


Developing a mobile app can increase your brand visibility and create a direct communication channel for users. But if you're not tracking the right KPIs, you're missing out on opportunities to improve your app's effectiveness.
The problem is that there's no shortage of KPIs, and tracking the wrong ones can waste resources and cause you to lose sight of your goals. So, which KPIs are best for measuring the success of your app?
This post will cover the top 30 app KPIs, including why they matter and how you should track them.
What Are App KPIs?
App KPIs, or key performance indicators, are metrics that gauge the performance of a mobile app. They can help you track progress against a specific goal and deliver more engaging user experiences.
The KPIs you should prioritize will depend on your specific app.
For example, if you have a gaming app, you'll want to track metrics like daily active users and average revenue per user. If you have a social media app, you'll emphasize metrics like number of subscribers and social shares.
Why Are Mobile App KPIs Important to Track?
The mobile app market is extremely competitive; mobile downloads are expected to reach 299 billion in 2025. Tracking the right KPIs can help you grow your business and stand out from the crowd.
Helps You Measure Success
App KPIs provide measurable benchmarks that help you track the performance and success of your app. The right ones can help you determine if your strategies are on track.
A common app KPI is user acquisition. By tracking this metric, you can assess the effectiveness of your acquisition strategies and change course if necessary.
Helps Reduce Your Churn Rates
The following graph shows churn rates - the percentage of users who stop using an app - for different industries:
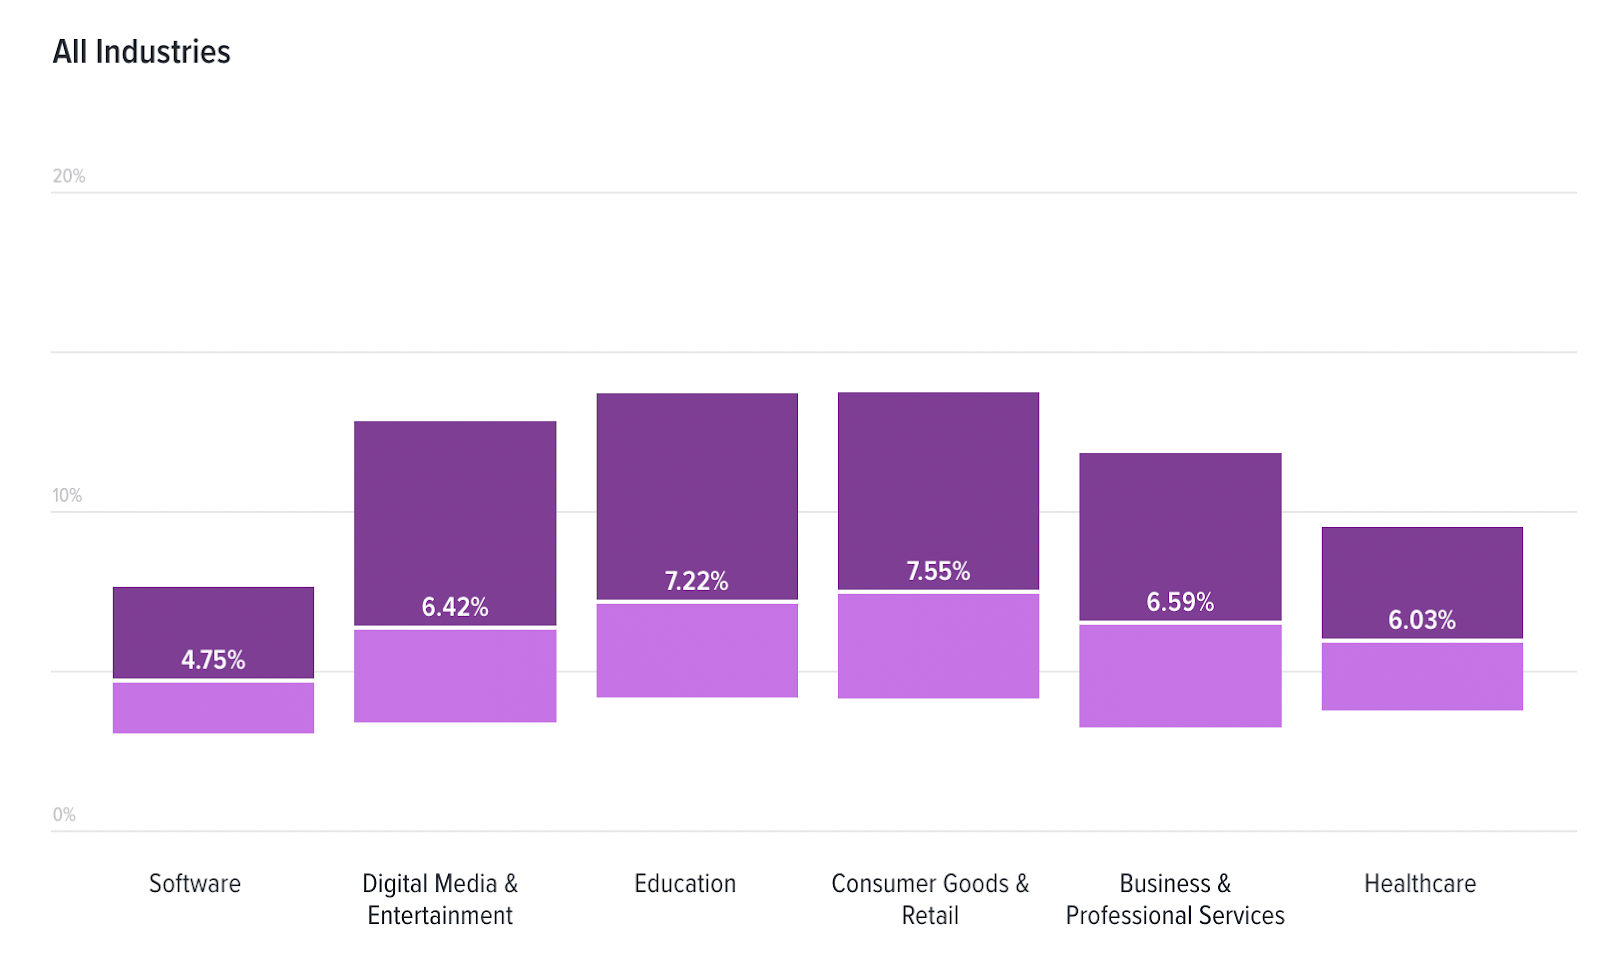
Churn is an inevitable aspect of every business. However, tracking the right KPIs can help determine where your users are dropping off and devise strategies to increase retention.
Align Your Team Around Specific Goals
Finally, tracking app KPIs can help align your team and focus their efforts around a "North Star metric" - a metric that captures the core value of your product. This metric varies for every company.
For example, Netflix's North Star metric is 'Watch Time,' and Airbnb's is the 'Number of Nights Booked.' Both companies use these metrics to align their team around a shared goal and inform decision-making processes.
Top 30 App KPIs You Should Be Measuring in 2025
We've divided the most important app KPIs to track into three key categories:
- App engagement KPIs
- User experience (UX) and performance KPIs
- Revenue KPIs
App Engagement KPIs
Track these app engagement KPIs to learn how users engage with your app and identify areas for improvement.
We'll cover these metrics:
1. Daily Active Users (DAU)
Daily active users is a metric that measures the number of unique users who use your app on a daily basis. It can help you measure the usage and growth of your app.
How to calculate:
- DAU = Number of unique users who use your app within a 24-hour period
2. Monthly Active Users (MAU)
Monthly active users look at the number of unique users who use your app each month. It helps gauge month-over-month growth.
How to calculate:
- MAU = Number of users who engage with your app within a 30-day period
3. Stickiness Ratio
The stickiness ratio shows how "sticky" your app is by measuring how many users return regularly to your app. A high stickiness ratio means high engagement rates, with a higher proportion of daily users.
How to calculate:
- Stickiness ratio = DAU / MAU
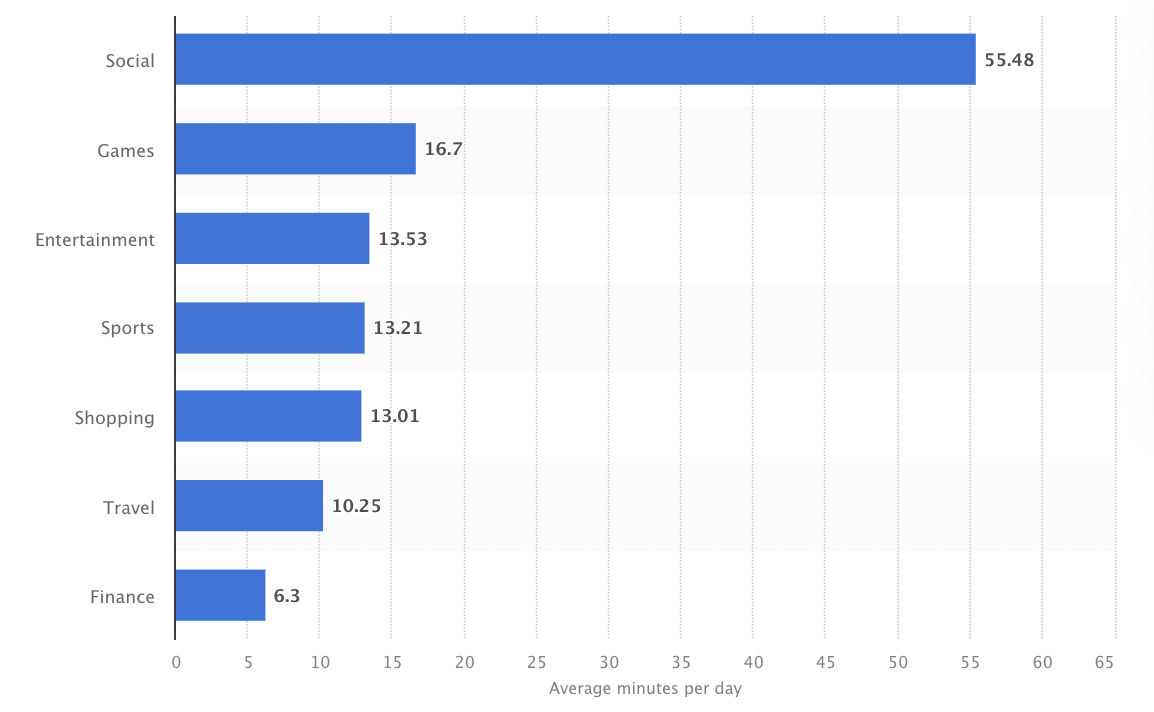
4. Session Length
Session length is the time a user spends with your app from the moment they launch it until they close it. This metric can help determine if users stay in your app long enough to complete a desired action.
Apps like Facebook and Instagram tend to perform well on this KPI, with users spending an average of 55 minutes per day on them.
How to calculate:
- Average session length = Total session length / Number of sessions
5. Screens Per Session
Screens per session look at the average number of screens your users view in a single session. It can indicate whether users find your app interesting enough to explore further.
How to calculate:
- Screens per session = Total screen views / Total sessions
6. Retention Rate
Retention rate tracks how many users return to your app after downloading it. A high retention rate indicates that users are deriving value from your app.
How to calculate:
- Retention rate = (Monthly active users / Total app installs) x 100
7. Churn Rate
Churn rate is an important metric, as it looks at the percentage of users who stop using your app. A high churn rate could indicate issues like poor customer fit or lagging features.
How to calculate:
- Churn rate = (Lost users / Users at the beginning of a period) x 100
8. Abandonment Rate
Data shows that 25% of apps are only used once after downloading.
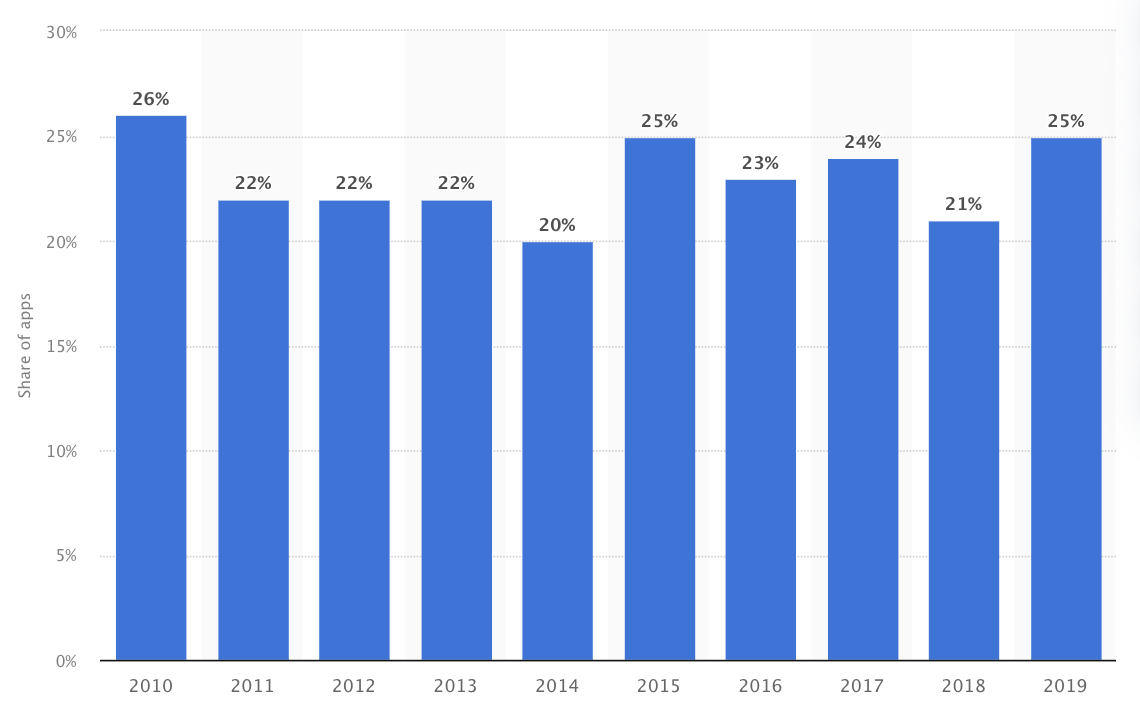
The abandonment rate is different from the retention and churn rate. This metric looks at how many users download and install your app but don't complete the signup process.
How to calculate:
- Abandonment rate = (Users who stop using the app / Total number of app users) x 100
9. In-App Actions
In-app actions refer to the number of actions users take inside your app. Examples can include liking a post, making a purchase, or watching a video.
How to calculate:
- In-app actions = Number of users who complete a desired action / Total number of users
10. Push Notification Engagement
Push notifications are powerful tools that can drive user engagement. Push notification engagement tracks the percentage of users who interact with your notifications.
How to calculate:
- Push notification engagement = (Number of users who interacted with a push notification / Number of push notifications sent ) x 100
User Experience and Performance KPIs
Tracking user experience (UX) and performance KPIs can help you identify and address in-app issues preventing users from navigating your app effectively.
We'll cover the following metrics:
11. App Speed
If your app is too slow, users won't hesitate to abandon it. App speed refers to how quickly your app loads and executes functions. Keep loading times as fast as possible to ensure users have a good experience.
How to calculate:
- Use tools like Chrome DevTools or Safari Web Inspector to calculate load times
12. App Latency
Latency is another performance metric of responsiveness, which captures how long it takes to request and receive a response from a server or API.
How to calculate:
- Use tools like Chrome DevTools to calculate your app's latency
13. Task Success Rate
Task success rate measures the percentage of users who complete a given task within your app. A poor success rate could indicate problems with app usability.
How to calculate:
- Task success rate: (Number of completed tasks / Number of attempts) x 100
14. Error Occurrence Rate
Error occurrence rate tracks the number of errors or failures your users encounter during a specific task. It can help you identify problem areas within your app.
How to calculate:
- Error occurrence rate = (Number of errors occurred / Total number of errors for all users) x 100
15. Crash Rate
Crash rate tracks the frequency of crashes users experience while using your app. A low crash rate indicates good app stability and performance.
How to calculate:
- Crash rate = (Number of crashes / Total number of app sessions) x 100
16. Operating Systems
Here's the market share of iPhone and Android in the US:
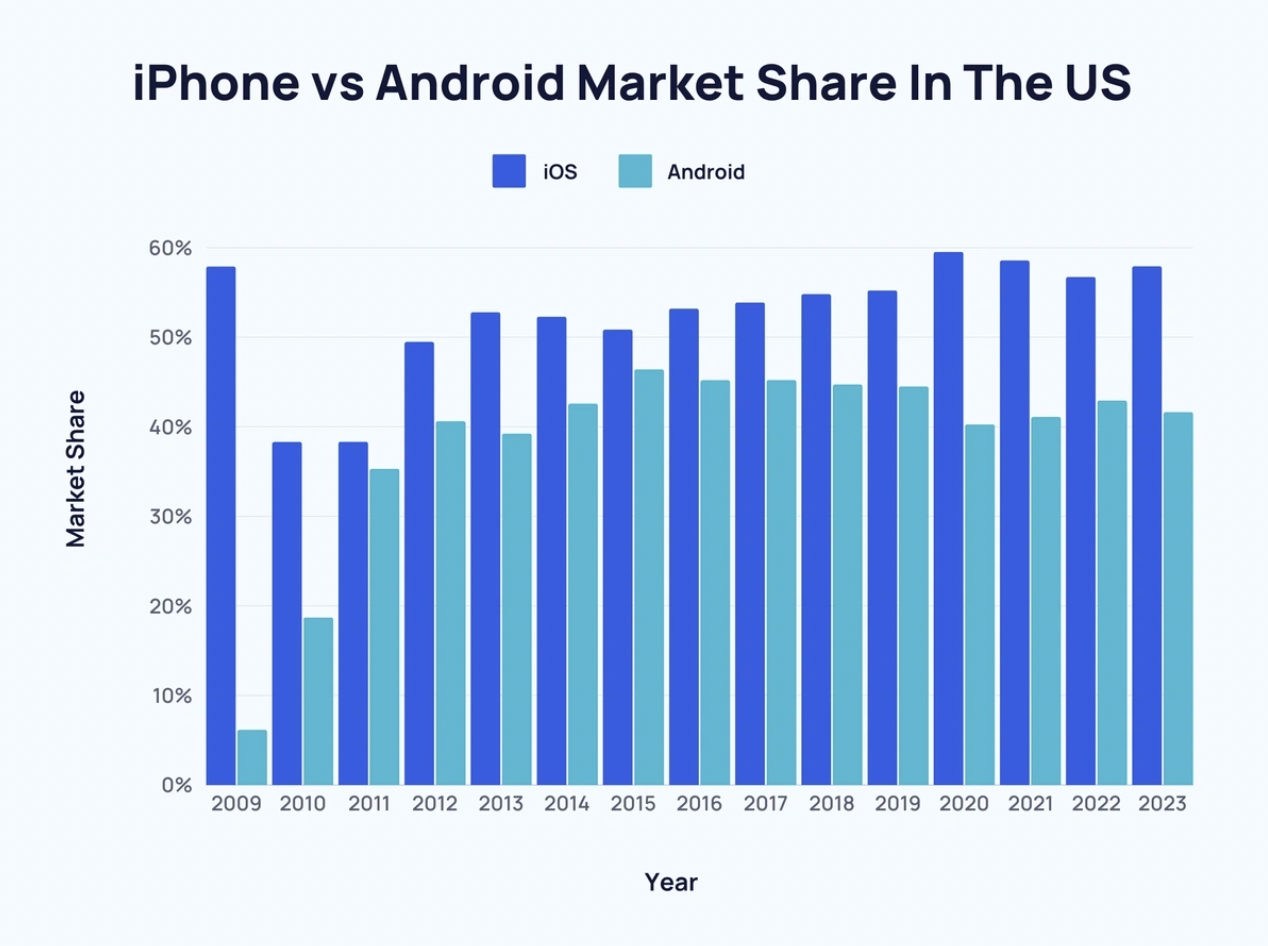
Tracking the usage of your app on operating systems like iOS and Android can provide insights into your app's performance across different platforms.
How to calculate:
- Use mobile analytics tools like Mixpanel or Amplitude to determine the operating systems that your users are on
17. Devices
Knowing whether your users are on smartphones or tablets is essential, as these devices have different design and development considerations.
How to calculate:
- Use tools Mixpanel or Amplitude to determine what devices your users are on
18. App Ratings
App ratings can help you gain insights into the overall sentiment towards your app. A sudden drop in positive ratings could indicate that users are unhappy with a recent change.
How to calculate:
- View your app's rating data in the Apple App Store or the Google Play Store
19. Net Promoter Score (NPS)
Net Promoter Score is a great way to measure user loyalty. It asks users one question: "How likely are you to recommend our app to a friend or family member?"
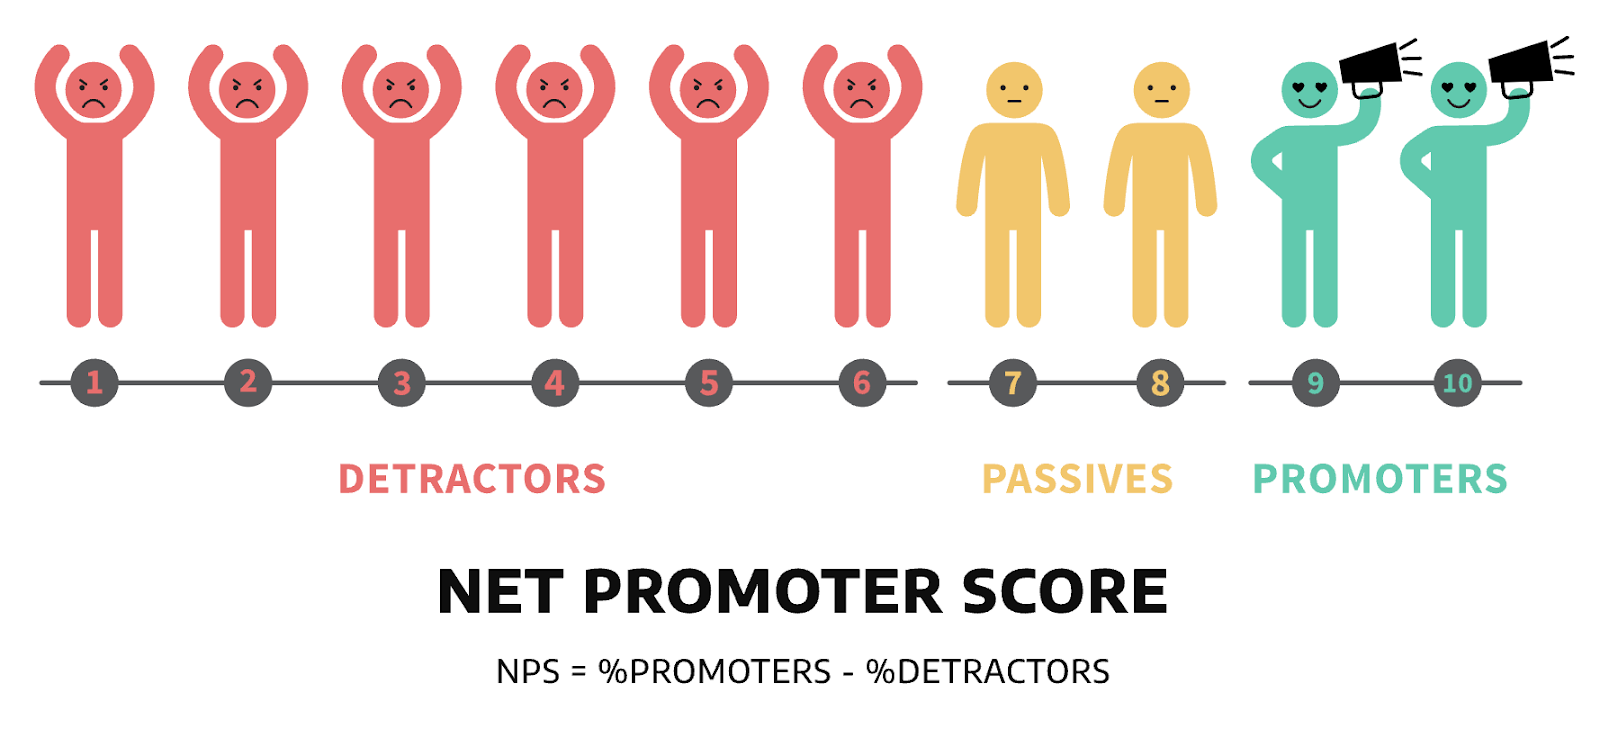
How to calculate:
- NPS = Percentage of Promoters - Percentage of Detractors
20. Customer Satisfaction Score (CSAT)
Customer Satisfaction Score is another metric that quantifies user experience. It asks users to rate their satisfaction with your app on a five-point scale.
How to calculate:
- CSAT = (Number of satisfied customers (those who rated four and five) / Number of responses ) x 100
Revenue KPIs
Revenue KPIs help you assess your app's financial performance and measure the effectiveness of your monetization strategies.
Here are the metrics we'll cover:
21. Time to First Purchase
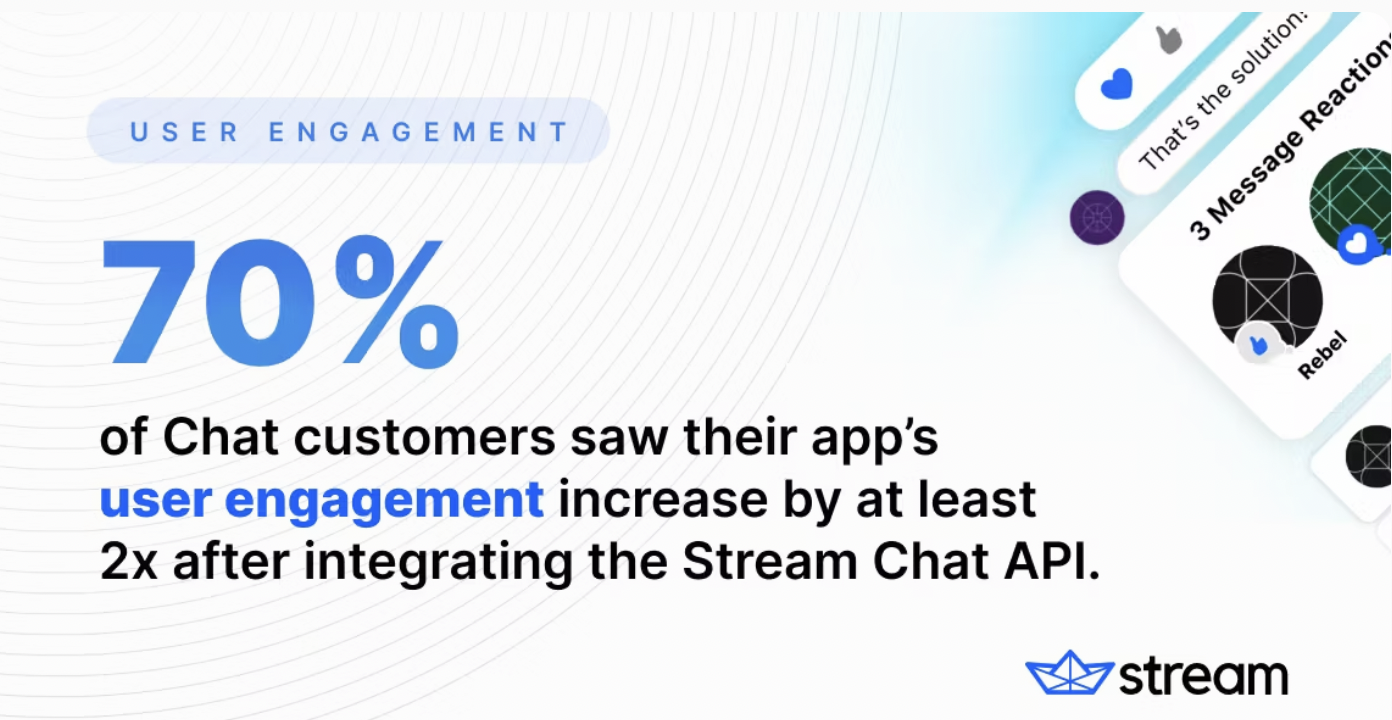
Time to First Purchase measures how long it takes for a user to make their first purchase in the app. One way to shorten the average time to purchase is by using the Stream Chat API to add in-app messaging to your apps.
How to calculate:
- Define the first purchase event and track the average time it takes for users to complete that action
22. Average Revenue Per User (ARPU)
Average revenue per user calculates how much revenue each user generates on average. It's useful for calculating the ROI of your app marketing and the lifetime value of your users.
How to calculate:
- ARPU = Total revenue / Total number of users
23. Total Revenue
Total revenue measures your app's earnings from all sources, including in-app purchases, subscriptions, and advertisements. It doesn't factor in expenses, but you can use this metric to understand your app's financial growth over time.
How to calculate:
- Total revenue = Average revenue per user x Number of users
24. Average Order Value (AOV)
The average order value is the average dollar amount your users spend per order. If you own an eCommerce platform, you'll want to track this metric and find ways to improve it.
How to calculate:
- AOV = Total revenue / Number of orders
25. Lifetime Value (LTV)
Lifetime value is the income a business can expect from a customer over their lifetime. A high LTV is a good indicator of product-market fit, as it means users are actively returning to your app (and spending money).
How to calculate:
- LTV = Average order value x Average purchase frequency x Average customer lifespan
26. Conversion Rate
The following graphic shows average conversion rates by category for the US App Store:
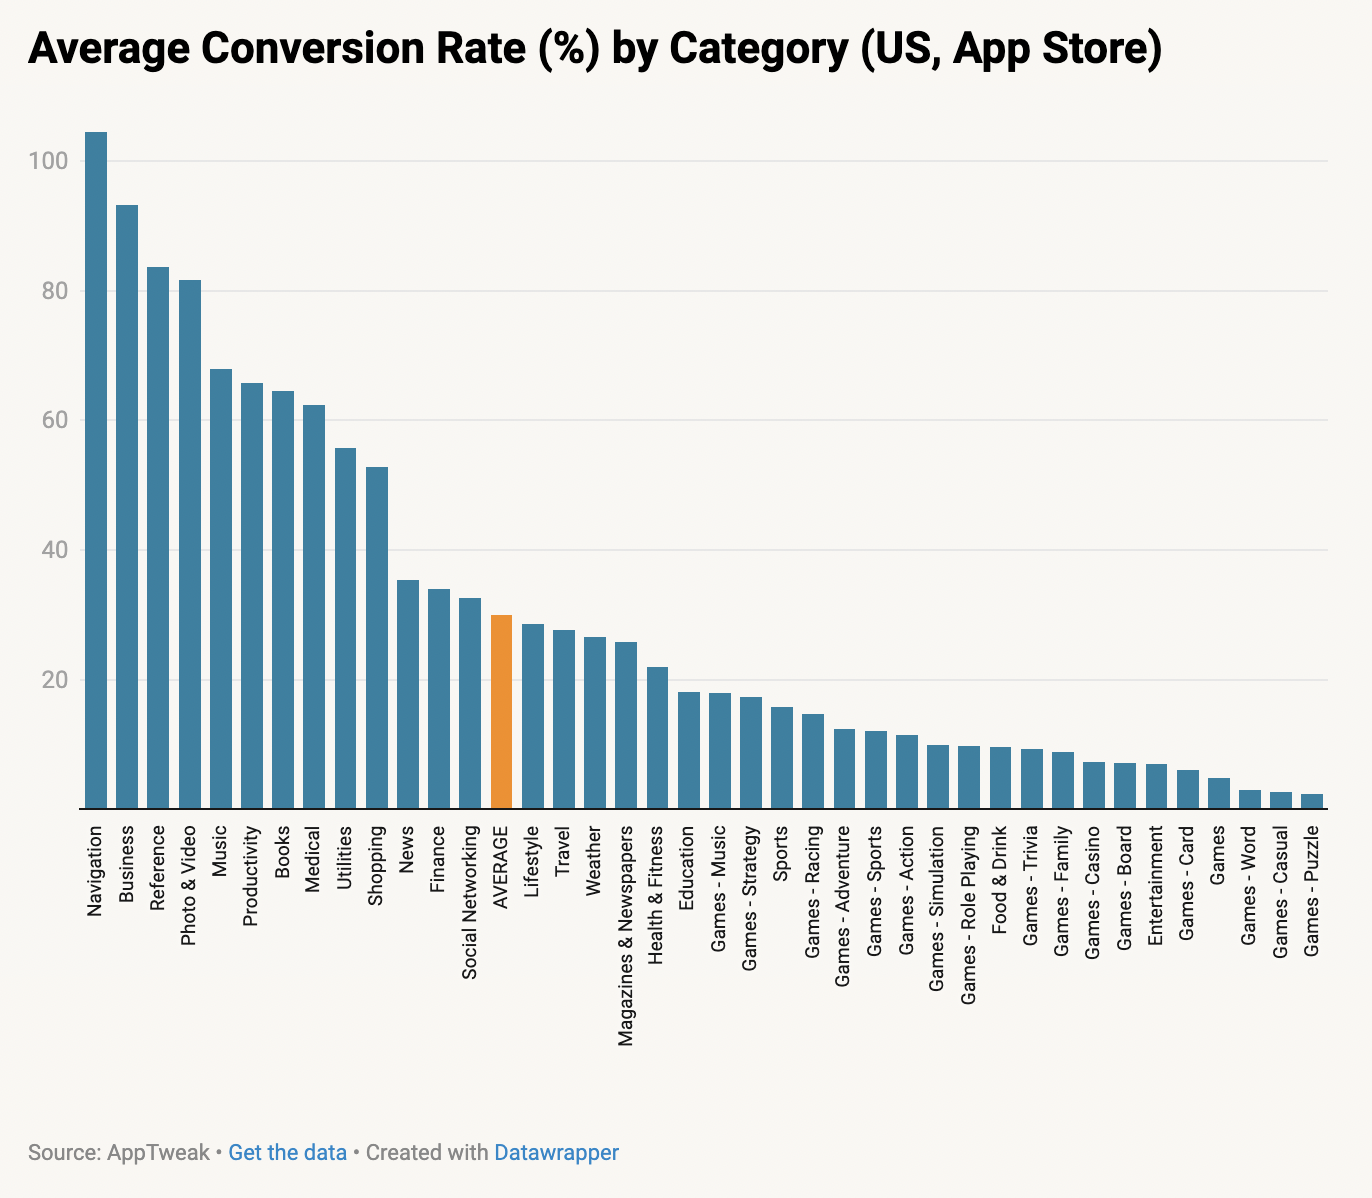
Conversion rate measures the rate at which users complete a desired action, such as making a purchase. Ways to drive more in-app conversions include optimizing onboarding and adding in-app chat.
How to calculate:
- Conversion rate = (Number of users who complete a desired action / Total number of users) x 100
27. In-App Purchase Revenue
In-app purchase revenue looks at how much your app generates from inside the app. It can include one-time or recurring purchases of extra content.
How to calculate:
- In-app purchase revenue = Total revenue - Revenue from other sources
28. Subscription Revenue
Subscription revenue tracks the revenue your app generates from user subscriptions. A steady recurring revenue enables you to predict future cash flow and manage your expenses.
How to calculate:
- Subscription revenue = Number of subscribers x Average subscription price
29. Cost Per Acquisition (CPA)
Cost per acquisition calculates how much it costs to acquire a new user on average. You can segment CPA by channels to determine where you should invest.
How to calculate:
- CPA = Total advertising spend / Number of users acquired
30. Return on Investment (ROI)
Return on investment helps you track the profitability of your app over time. It measures how much your app earns for every dollar you spend to create and promote it.
How to calculate:
- (ROI = Total revenue - Total cost / Total cost) x 100
Key App KPIs Takeaways
Here we've broken down the top 30 mobile app KPIs that you should track into three categories: app engagement, UX and performance, and revenue.
App engagement KPIs help you understand how users engage with your app, while performance KPIs help you determine how it performs from a technical standpoint. Tracking revenue KPIs help you measure profitability and can even uncover ways to drive more revenue.
By tracking these metrics and aligning them with your specific goals, you can make more informed decisions and improve your app's performance.