

User acquisition is integral to growing your product and customer base. But that's just the first part: success depends on retaining those existing users and keeping them engaged in the long term.
As Brian Balfour, former VP of growth at HubSpot, once said: "If your retention is poor, then nothing else matters."
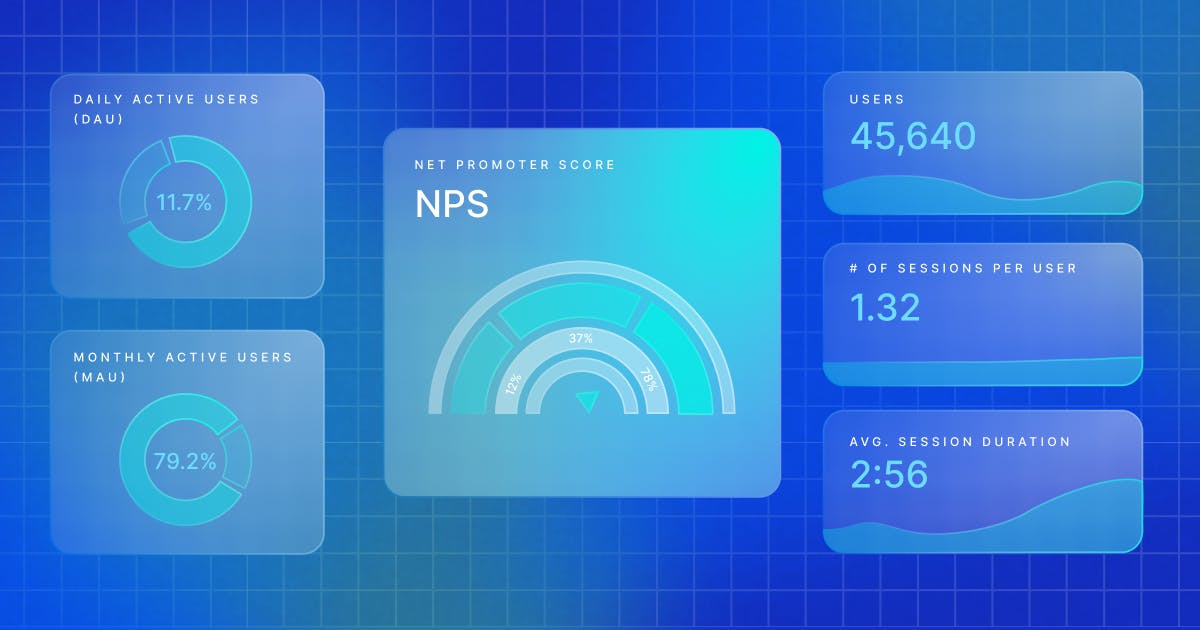
As a product manager, you need to take a holistic view of user engagement to get the complete picture of how people use your app and where you can find retention problems. Here are the key product engagement metrics you must use to determine your success:
-
Daily Active Users (DAU) and Monthly Active Users (MAU)
-
User Stickiness
-
User Churn
-
Average User Session Duration
-
Net Promoter Score (NPS)
Daily Active Users (DAU) and Monthly Active Users (MAU)
As the name suggests, your Daily Active Users (DAU) refers to the number of people that hop on your app daily. How you decide what counts as "active" is up to you: maybe having a user open the app might be enough, or you may want to only count users who perform specific minimum actions.
On the other hand, your MAU is the total number of users that log into your product across 30 days. It's one of the key metrics that Facebook, for example, uses to measure its user engagement.
What It Means for Your App's Success
A healthy number of users that log into your product is a good sign that they're getting value from your app. Also, technology investors often look at an app's DAU to determine its potential for growth and success.
How To Measure It
(Unique New Users) + (Unique Returning Users) = Total DAU.
How To Use the Metric
Measuring your DAUs/MAUs gives you a granular picture of usage over time. However, even a "healthy" number might be bad news if it's significantly lower over a year.
You can also use DAUs/MAUs to gauge the impact of new feature launches or to assess the damage caused by faults or outages. If the app suffers from problems that need a patch update, and you see DAUs/MAUs start to decline from that point onward, you know what triggered the loss of business.
User Stickiness
Your "user stickiness" is the number of users that frequently hop back on your app across a month. A high rate of user stickiness reduces churn, improves customer lifetime value, and offers more opportunities to upsell offers to app customers.
What It Means for Your App's Success
Getting repeat customers is essential for your app's success. If users frequently return to your product for more and renew their subscriptions, then your app does an excellent job serving their needs.
How To Measure It
DAU / MAU = User Stickiness.
How To Use the Metric
If you have high MAUs but declining stickiness over time, it could mean that your product is failing at meeting the long-term needs of users and adapting to their changing expectations. A solution is implementing new updates and features that better serve your users and measuring how these changes impact retention.
User Churn
Your user churn is the number of customers that leave your app and never log back in. User churn is not the most fun metric to look at, but it provides you with a better understanding of your app's retention.
What It Means for Your App's Success
It's impossible to completely eliminate churn. But if your user churn is too high, it's a sign that something could be wrong with your product experience (such as glitchy UI when users sign up). To determine if your user churn is too high, look at this chart of the average retention rates per industry to see how you hold up.
How To Measure It
(Lost Customers ÷ Total Customers at the Start of the Time Period) × 100.
For example: 100 Lost Customers ÷ 1,000 Total Customers at the Start of the Time Period × 100 = 10.
In the example above, you'll have a churn rate of 10%.
How To Use the Metric
The key to analyzing your customer churn is identifying at which stages of the product journey users are most likely to drop off. Based on this information, you can focus on improving these vulnerable stages of the user journey to reduce churn.
You also want to divide your user churn list into different cohorts to identify which type of user is most likely to churn. The data will help you determine which kind of audience to avoid in your marketing campaigns.
If you're concerned about your high churn rate, another good practice is to ask for churned users' feedback through surveys or interviews to understand better why they leave your app. You can then leverage this feedback to make adjustments.
Average User Session Duration
Your average user session duration is how much time a customer spends within your app.
What It Means for Your App's Success
Average user session helps you determine if users are spending sufficient time within your product to see its value.
How To Measure It
Total Time Spent Across User Sessions ÷ Total Number of User Sessions.
How To Use the Metric
You need to determine the ideal user session for your app, which will depend on the type of product you manage.
For example, an app meant for quick use, such as a ride-sharing app like Uber, shouldn't have a long user session. A customer should be able to quickly choose a location, book a ride, and then hop off to wait for their cab.
If you're managing an online learning app such as Udemy that requires users to spend more time in the product to complete courses, then your ideal user session will be longer.
If your app's user session is too low for your industry, it could be a user experience issue. You must focus on improving your app's UI design and speed performance, eliminating any sources of friction, and adding features such as personalization to see if it improves your user session.
Net Promoter Score (NPS)
Your Net Promoter Score (NPS) is a score from 0 to 10 of how likely a user is to recommend your product to others. It was first developed by Fred Reichheld, a partner at Bain & Company, in 2003.
What It Means for Your App's Success
Your NPS measures how good your product is at creating customer advocates. It's also a solid loyalty metric.
How To Measure It
You can ask the user via an email survey or in-app message how likely they are to recommend your app to others on a scale of 0 to 10. It's worth noting, however, since the NPS metric relies on user reporting, it will be less reliable than data produced directly from app usage.
How To Use the Metric
You want to measure your NPS score over time to monitor if there are any changes to your customer satisfaction. If you see a drop in your NPS score, then you must run user research to understand why. For example, users could expect certain new features from your app that you have yet to implement.
Leverage Engagement Metrics To Build a Better Product
Adjustments to your app are the key to improving your product engagement metrics and building a better product. It's now up to you to test how different features and updates increase your user engagement over time.