


As businesses strive to stay ahead of the competition, they often turn to data to inform their decisions. But not all metrics are created equal, and some can be more harmful than helpful.
You've probably heard the term "vanity metric" (metrics that don't uncover meaningful data about your app) and you're probably here because you don't know how to identify them.
They seem attractive on the surface, but they can warp your understanding of your platform's performance and slow down your progress.
This blog post will cover what vanity metrics are in detail and how to identify them, along with examples and alternative metrics that give you real business insights.
What Are Vanity Metrics?
A vanity metric is any metric that seems impressive on the surface but doesn't paint a complete picture of your business performance or how you can improve it. They're flashy and easy to measure, but they don't offer any value beyond the surface.
For example, a metric like new users seems useful, but it doesn't tell you how much it costs to acquire each one, how many are engaged, and how many won't just abandon the platform shortly after.
Vanity Metrics vs Actionable Metrics: What's the Difference?
Actionable metrics are the opposite of vanity metrics. They present a clear relationship between actions and results, which is what makes them good indicators of performance.
In the example provided above, where the number of new users is a vanity metric, an actionable alternative would be the customer retention rate. This app KPI tells you how good your platform is at keeping users over time, and you can use this information to make long-term optimizations.
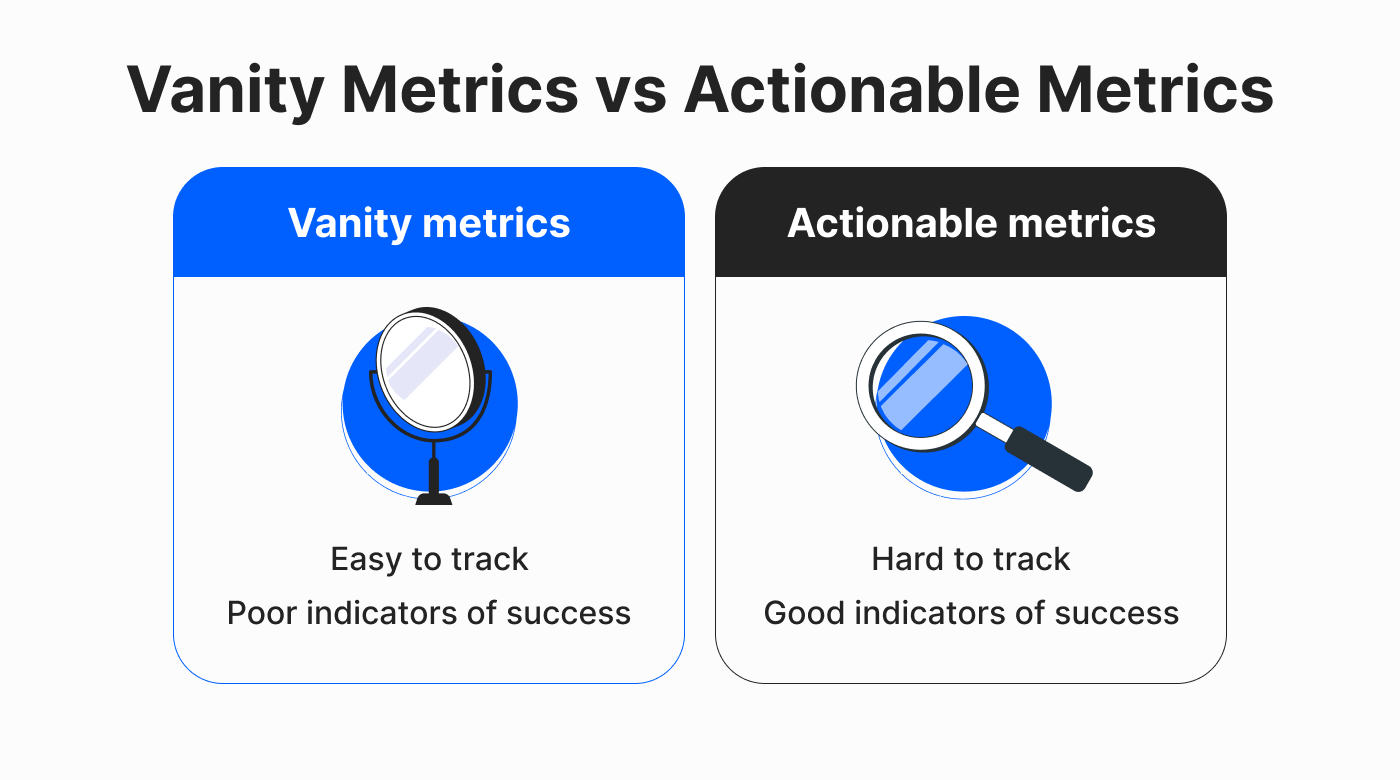
Where vanity metrics focus on surface-level indicators, actionable metrics go deeper and are often more granular. As a result, they take more work to measure and interpret. This, however, is what makes them reliable indicators of business success and health, and ideal for driving business decisions.
For example, one B2B company switched to actionable metrics, shifting focus towards effectiveness and efficiency within the customer journey. This change improved the customer experience, and the company saw its annual revenue grow by double digits.
This isn't to say that vanity metrics don't have a place, though. They're useful for non-commercial uses like marketing and impressing investors. After all, the number of users you have is a better metric to have on a landing page than the customer acquisition cost.
You can also take the vanity metrics you're tracking to develop them into actionable metrics as we'll discuss later in this article.
How Vanity Metrics Can Sometimes Fool You
Eric Ries, who first coined the term vanity metrics, says they can fool you if they're all you measure. This can make it challenging to find a clear direction in which to take your app:
When the numbers go down, we invariably blame someone else," says Ries. "Over time, this allows each person in the company to live in their own private reality. As these realities diverge, it becomes increasingly difficult for teams to reach consensus on what to do next.
Take the case of InList, a mobile app for booking exclusive nightlife events. The team fell into the trap of only measuring its new downloads when it first launched. According to company founder Gideon Kimbrell in a Forbes article:
I was thrilled by the number of downloads our app was getting upon its initial release... Its popularity validated the hard work we had done in choosing the right brand identity.
The high download numbers certainly helped us secure partners, contracts, and additional investors as well... But after a few months, we began to notice something: Many of these downloads weren't actually leading to fully qualified, revenue-generating users.
InList realized the product team needed other forms of data as well to make their vanity metrics more meaningful. Only then could the team have a better strategy to improve its app.
To have any value at all, [Vanity metrics] needed to be presented alongside percentages of users converted, retention rates, and other key performance indicators that could tell us not only where our users are coming from, but also which ones were staying on for significant lengths of time.
Amazon also suffered as a result of tracking vanity metrics. In its warehouses, workers had their productivity measured using several metrics, one of which was called the "time off task" or ToT. This number tracked how much time a worker spent doing something other than scanning items while on the clock.
On paper, it might seem like a solid way of quantifying productivity. In practice, however, it penalized workers for not moving fast enough through the massive warehouses and for technical issues with their scanners.
Eventually, the workers were pushing themselves farther than they could manage, leading to injuries, burnout, and other similar risks. Given Amazon's size, the ensuing attrition has some predictably severe consequences. Leaked documents show that the company loses $8 billion a year from its inability to retain workers long-term.
Wells Fargo dealt with a similar issue a while back when it defined success using the wrong metrics. The bank measured business growth by how many of its customers also bought other products and services, like checking accounts or credit cards. This pushed the bank's sales associates to sign up for various offerings in their customers' names without their knowledge.
By the time the scandal was uncovered, 3.5 million customers had been impacted, and the company was on the hook for billions of dollars in penalties.
Had the company also focused on customer-centric actionable metrics like retention and satisfaction, the scandal might not have advanced to such an extent.
Examples of Vanity Metrics for Mobile Apps and Saas Companies
Here are some common vanity metrics that seem important but, by themselves, don't tell you the whole story behind your app's performance:
New Downloads
Your mobile app's long-term success doesn't just depend on acquiring new users but also on other factors, such as your retention rate. While it's vital to get new users to your mobile app, Looker founder and CTO Lloyd Tabb doesn't believe that the metric paints the whole picture:
"The number of people who download your product has no correlation with your company's survival... How many apps go on viral spins and wither months (even weeks) later?"
Traffic
It's not enough to just get tons of traffic towards your mobile app landing page. While driving high traffic is essential to boost awareness around your mobile app, you also want to convert these visitors into actual customers.
If you're seeing high traffic but few of your visitors are converting, the traffic doesn't mean anything. You might be attracting the wrong users in your marketing campaigns, or your landing page copy doesn't do a good job of communicating the value of your app.
Total Number of Users
While your total number of users is a good metric to track, it doesn't help you fully understand your users' behavior.
For a clear demonstration of how user numbers are only good for optics, look at GitHub Copilot. Despite a quick climb to 1 million users, it's losing parent company Microsoft $80 per user per month and struggling to turn a profit.
Social Media Followers and Likes
An active social media presence is an excellent way to boost awareness of your mobile app. That said, likes and followers qualify as vanity metrics because they're easy to manipulate.
To understand just how much of an issue this is, Facebook took action against 2.6 billion fake accounts last year alone: that's almost as many users as there are on the platform, and those are the ones that were identified and acted on.
A lot of social media metrics also don't tell you how many of these followers become paying users or engage with your app.
How To Identify Vanity Metrics With 3 Questions
Still not sure whether the figure you're tracking is a vanity metric?
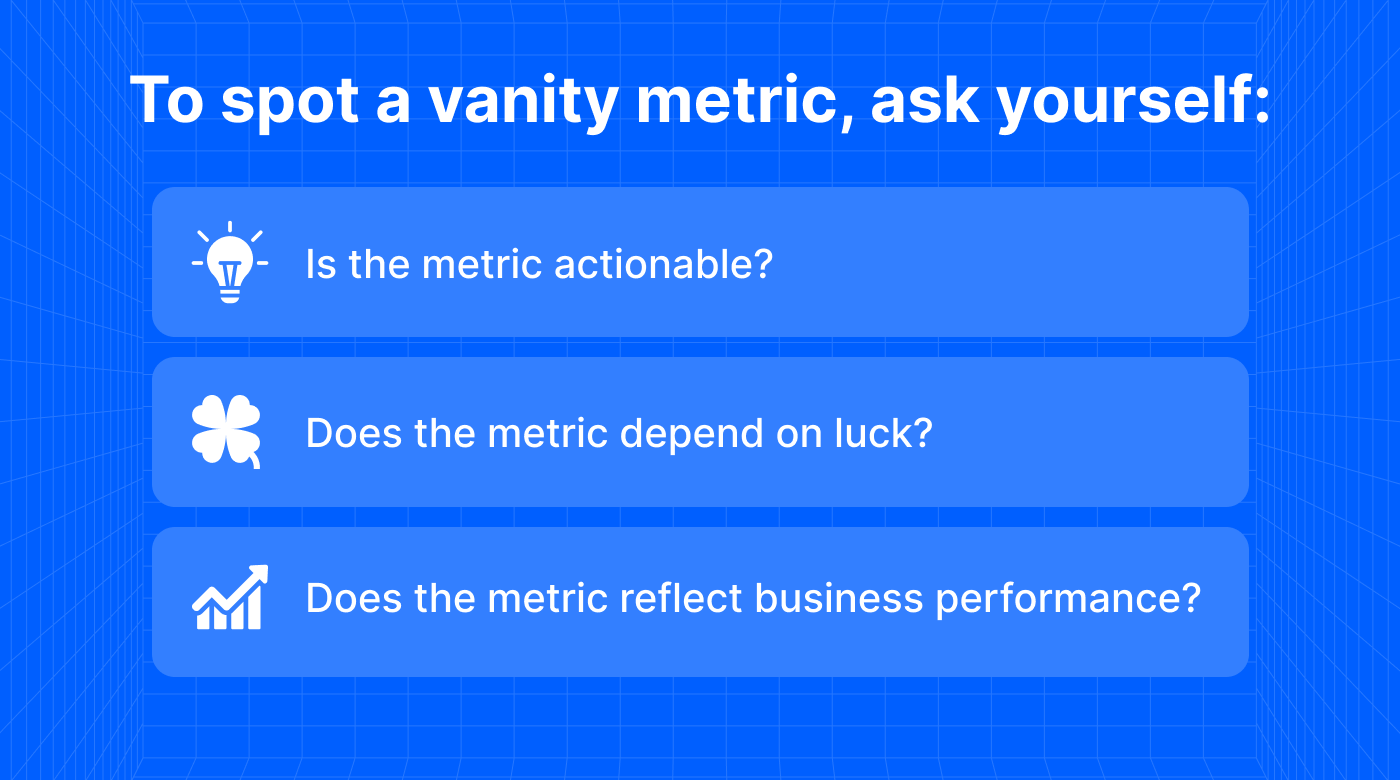
Ask yourself these three questions to find out.
Is the Metric Actionable?
Each time you look at a metric, ask yourself if it's possible to make a business decision or product initiative based on it. If not, the metric itself won't be enough to indicate where your app can improve. You'll need other complementary metrics to make a business decision about it.
For example, a high amount of page views looks good, but that doesn't tell you anything about how to turn those visitors into sales.
An actionable alternative would be looking at what percentage of users successfully moved onto the next stage. People who visit your website then go on to sign up, people that sign up then become paying customers, and so on. This metric is called the conversion rate, and you can use it to organize effective digital campaigns.
Does the Metric Depend on Luck?
A quality metric needs to be something you have control over and not dependent on luck. Otherwise, the data you're measuring becomes inaccurate and not replicable.
Going viral is definitely something to brag about, but it's hard to predict and almost impossible to recreate even if you replicate the conditions that previously resulted in virality.
Instead, you can look at referral traffic to see how many people used the viral content as a starting point to learn more about your business. You can measure this by comparing traffic to your platform(s) as a percentage of the impressions you received on social media to see how effective your content is at driving conversions.
Does the Metric Reflect Business Performance?
A metric needs to be as accurate as possible and genuinely reflect your business performance. Otherwise, it could mislead your team into believing things about your mobile app or strategy that aren't true.
A million app downloads looks good on paper, but that figure doesn't reflect business performance because it doesn't tell you how many of them continue to use the app and eventually turn into paying customers.
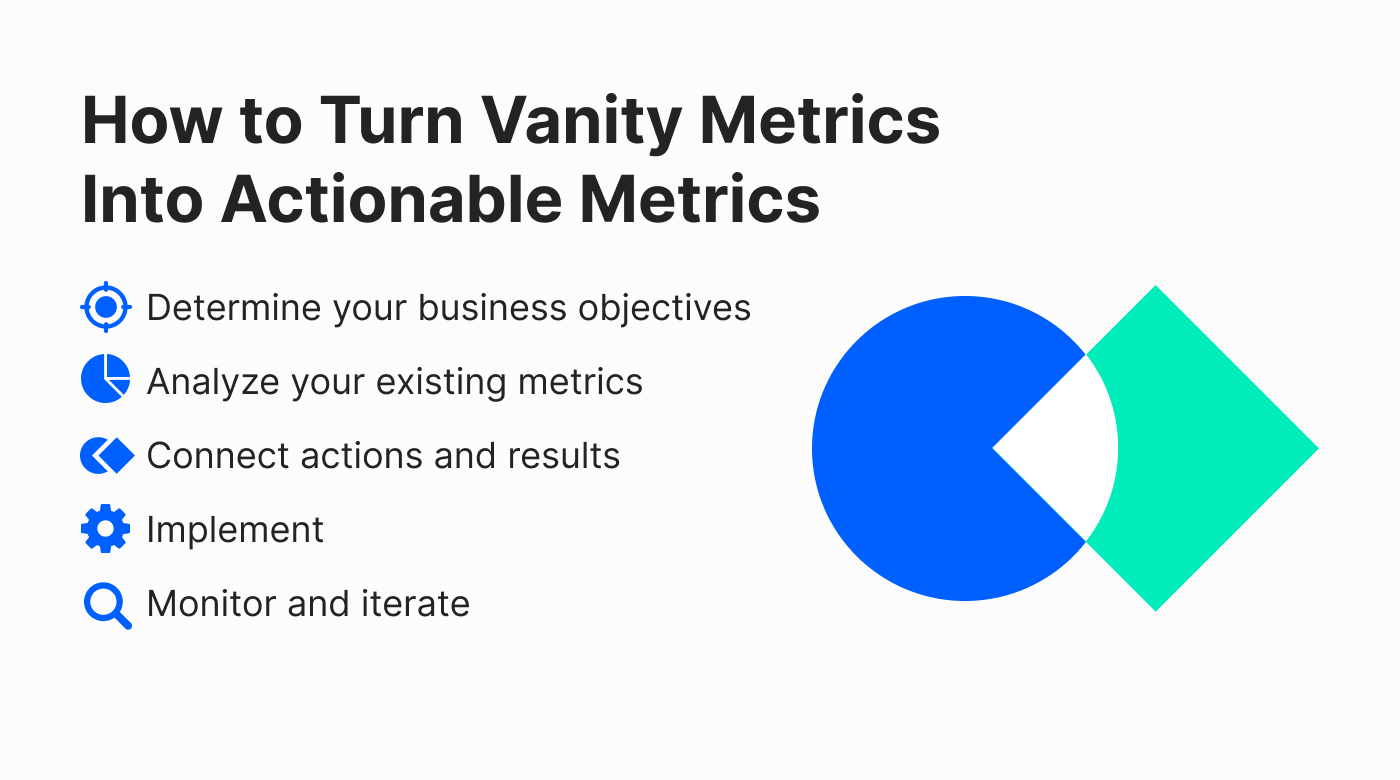
How Can Vanity Metrics Be Turned into Actionable Metrics?
Turning vanity metrics into actionable metrics involves shifting your focus from surface-level numbers to valuable insights that drive meaningful improvements in your business.
Here's what you should do to make this transition and apply the new metrics towards achieving success.
1. Determine Your Business Objectives
Finding the right actionable metrics to track requires you to identify what business results you're interested in pursuing.
Shopping cart abandonment rates and active subscriptions are both actionable, but that doesn't mean they're the right metrics for every business to measure.
Moreover, a business should prioritize certain metrics depending on where it is in its journey. For example, a new company should focus on getting the word out, whereas a large company should focus on increasing its return on investment.
2. Analyze Your Existing Metrics
With your business goals in perspective, evaluate the metrics you're currently tracking and how much they tell you about hitting those targets.
Use the three questions we provided above to determine whether they're vanity metrics. If they are, try to figure out ways to build on them. The objective isn't to toss them out and start over, but to extract value from them.
You were likely tracking those metrics for a reason, and, like we said, they're not all useless. Throughout this article, we've provided several instances of how you can take a vanity metric and use it to get a headstart with an actionable metric.
For example, you can use app download figures to advance into retention and churn rates.
3. Connect Actions and Results
Just to make sure you're switching to the right metrics, you should do the first step of the process but from the other side --- evaluate how the actionable metrics move you towards your business goals.
For example, you might have switched from tracking total users to measuring customer success in a bid to increase revenue in the next 12 months. In this instance, you should outline what business decisions you can make based on your customer satisfaction scores that should translate to revenue growth.
The goal of this stage is to build a roadmap for the next step and make sure you don't commit to the wrong actionable metrics. Therefore, if you're struggling to find a clear link between an action and a result, you might need to go back to the previous step.
4. Implement
Now, it's time to test how useful the actionable metrics you've settled on actually are.
Start tracking the metrics and analyzing them to derive as much insight as you can, then use your findings to inform business decisions. Here's where you act on the roadmap you created in the previous stage.
For instance, if you're using customer success to increase revenue, you can provide responsive support, streamline the customer journey, deliver personalized experiences, and implement a feedback loop.
5. Monitor and Iterate
Actionable metrics are useful because they give you a complete picture of your business' health and performance, both of which aren't constant. For success, continuously refine your approach based on data and adapt to changing market conditions, customer preferences, or business goals.
For instance, early in a company's lifespan, customer satisfaction and engagement metrics might take precedence over customer lifetime value. If the company grows to a point where it has tons of engaged and satisfied users but most of them are on free plans, it might be time to switch gears to focus on conversion rates.
Examples of Actionable Metrics
The metrics below are actionable and provide good clues on the overall performance of your app. When you combine them with vanity metrics, you'll have all the data you need to understand the full picture of your app's performance:
Churn Rate
Your churn rate measures how many users ditch your app after a specific period of time. It's a metric you want to measure alongside your new registered users, so you can get an idea of how many unique users you can get versus how many you lose.
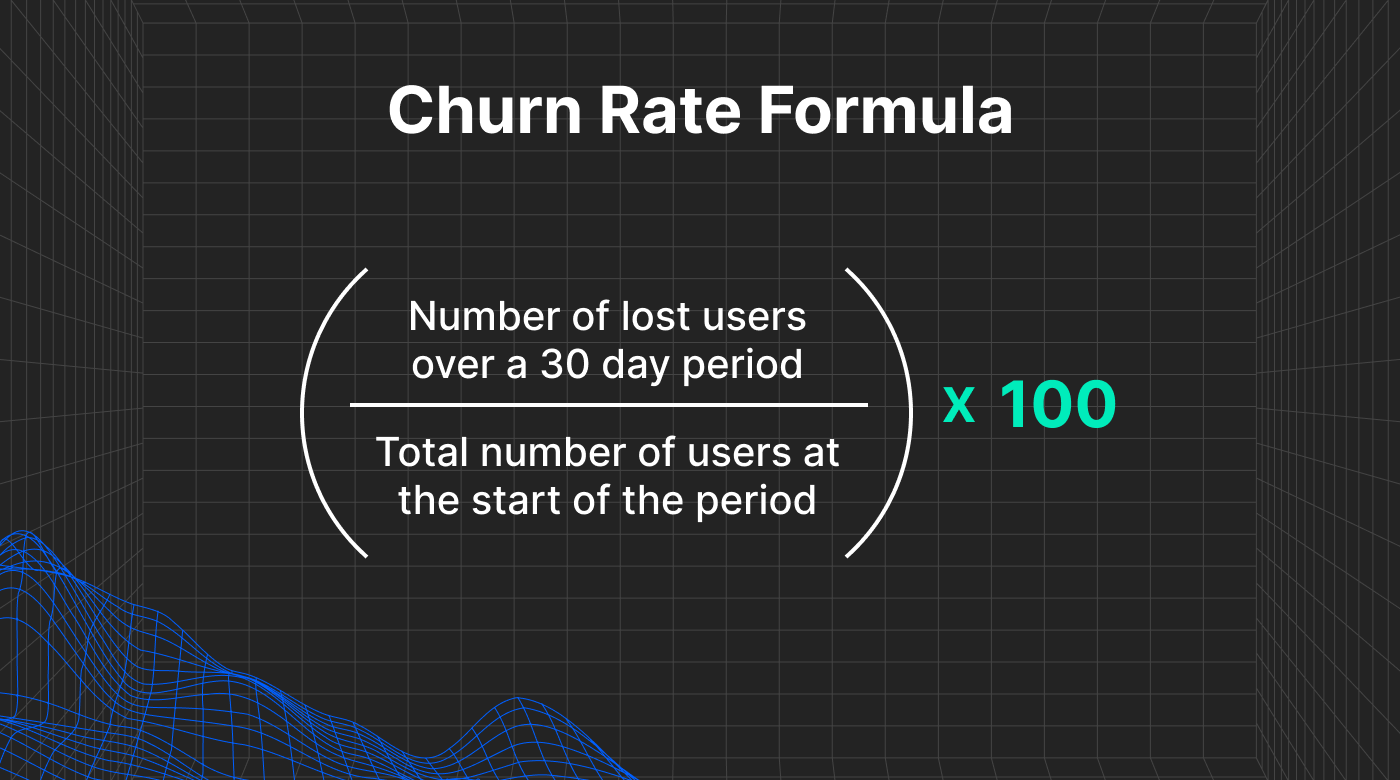
You must track this metric frequently because a churn rate that's too high could be a sign that there's something wrong with your user experience.
Use the formula below to calculate your churn rate:
(Number of users you lost over the past 30 days / Number of users you had at the beginning of the month 100) x 100 = monthly churn rate
User Stickiness
"Stickiness" refers to how many users "stick" to your app and remain loyal. It's an important metric to monitor since your app's long-term success depends on how good you are at retaining existing users.
Use this formula to calculate your user stickiness:
Daily Active Users (DAU) / Monthly Active Users (MAU) = User Stickiness
Average User Session
There's no point in getting new users if they're not actively using your app. Average user session helps you determine how engaged users are with your app by telling you how much time they spend inside it.
The ideal average user session, of course, will depend on the type of app you manage and what kind of experience you want to provide.
If you're working on a music streaming app like Spotify, for example, longer user sessions are good enough.
On the other hand, if you're managing a ride-hailing app like Uber, then your average user session should be pretty short. The user should be able to hop on the app quickly, schedule a ride, and get picked up as fast as possible.
Calculate your average user session with the formula below:
Sum of all users' individual sessions / total number of sessions in a day = Average User Session
Net Promoter Score (NPS)
One in three people say user reviews are what determine their decision to spend money with a business. This means that focusing on getting users to like your brand and build loyalty might yield better results than, say, investing in paid advertising on social media.
The issue with many new users is that the metric alone doesn't show how satisfied users are with your app, which is where the Net Promoter Score (NPS) comes in. The score measures how likely users are to recommend your app on a scale of 1 to 10.
A score of 10 on the NPS means the customer is highly satisfied with your app. A score of 1, however, means they're extremely unlikely to spread the word about your app to others. There are three levels of customers for you to identify with these surveys:
-
Users who rate you between zero and six are detractors. They're unhappy with your product or service, and are likely to spread negative word about it.
-
Users who rate you either seven or eight are passives. They're indifferent, and aren't likely to say anything about your app.
-
Users that rate you nine or 10 are promoters. They're highly satisfied with your app, and they're likely to recommend it to others and leave positive reviews.
Calculate your NPS using the following formula:
Percentage of detractors - percentage of promoters = Net Promoter Score
To get the most out of your NPS survey, make sure to also include open-ended questions where the user can provide feedback from within the app to identify areas of improvement.
Don't Let Vanity Metrics Trick You
"Vanity metrics aren't useless," says Looker founder Lloyd Tabb. "They have their use case but are points of comparison for other people to evaluate you."
Once you go through your data to better understand your mobile app performance and user behavior, it's time to make improvements. For example, that could include adding features to your app such as activity feeds and chat messaging to increase app engagement.
With these actionable insights, you can make optimizations that improve the user experience, from first contact, all the way to onboarding and beyond.