

We've all been in the situation where we're typing out a message in an app and think, "actually, I just need to call this person."
In-app voice and video calling is how you add this functionality to your product. With in-app video, your users can talk to each other without jumping to a different app. Instead of saying "Hey, what's your number?" or "Let's hop on Zoom," they can simply press a button and talk. This allows users to keep the context while increasing the amount of information they can share.
Voice and video calling provide a high-speed lane for communication. Tone, emotion, complex ideas: all are better conveyed with voice and video.
In this guide, we will begin with high-level concepts, including the what and why of in-app calling, and progressively dive into the technical details of how in-app calling works, covering architecture, protocols, and best practices for implementation. We will cover both voice calling and video calling, highlighting key use cases, benefits, and considerations for each, so you can make an informed decision to enable your users to communicate more effectively.
What Is In-App Calling?
In-app calling refers to the integration of voice and video call functionality directly within a mobile or web application. Instead of dialing a phone number over the traditional network or using an external video or voice application (such as Zoom), users initiate calls directly through the application. This means a user can tap a call button in the app and speak face-to-face or voice-to-voice with another user without needing to leave the app.
Some popular tools that use in-app voice and video calls include:
- WhatsApp: The messaging app that lets you call or video chat anyone in your contacts list, making it easy to switch from texting to talking when you need to have a longer conversation.
- Slack: The workplace collaboration tool where you can jump from a message thread to a huddle or video call with your teammates to quickly work through problems together.
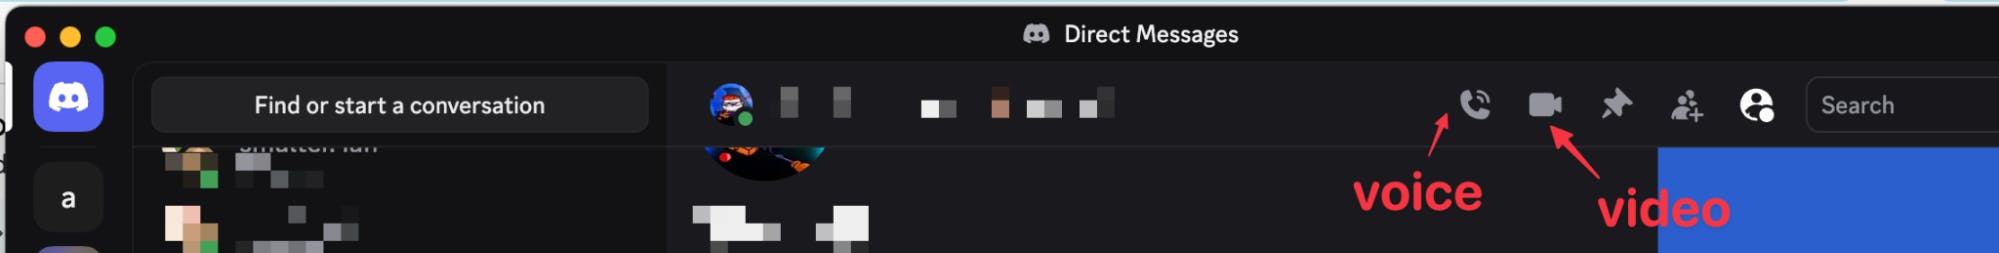
- Discord: The community and gaming platform where you can hop into voice channels to chat while playing games or join video calls to hang out with friends.
- Instagram: The social media app that lets you start video calls with up to 8 people right from your DMs, perfect for catching up with friends face-to-face.
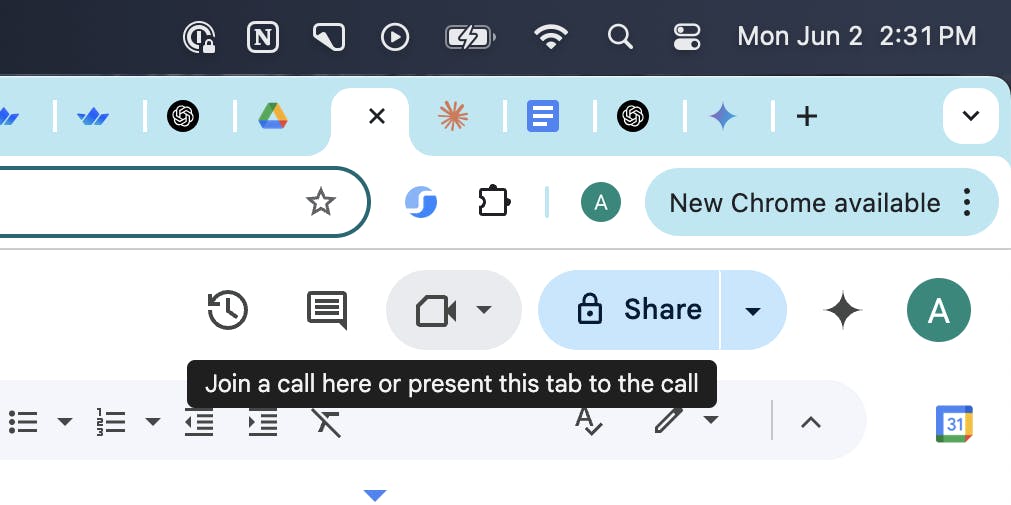
Even tools like Google Docs allow you to start a call directly within the application rather than moving to Google Meet.
At a more technical level, in-app voice and video calls are real-time, peer-to-peer connections that rely on Web Real-Time Communication (WebRTC) to create real-time connections between users. Your app needs to negotiate connections through signaling servers, STUN/TURN servers, and establish secure peer-to-peer channels for the actual audio and video streams. In-app calling leverages the same web standards that power video calls in your browser, but these protocols are abstracted away by modern voice and video call tooling.
The Benefits of In-App Calling
The most significant benefit of in-app calling is improved user experience. In-app calling keeps users within your app's ecosystem. There's no need to switch to a phone dialer or another app to make a call. This prevents fragmentation of the user journey and creates a smooth, uninterrupted experience.
For example, a customer browsing an e-commerce app can tap a support button to instantly connect with an agent about a product question, without losing their place in the app or having to dial a separate number.
Other key benefits of in-app calling are:
- Enhanced engagement. Real-time voice and video add a human touch that text alone can't provide. These richer interactions increase user engagement and encourage communities to form within the app. In social or dating apps, users can transition from messaging to video calls to build authentic connections. Gaming platforms use voice chat to let players coordinate strategies and build camaraderie during multiplayer matches.
- Privacy protection. In-app calls can protect user privacy by masking personal phone numbers. Users connect via their app identities, allowing them to communicate without exposing their phone number or leaving the app's secure environment. Marketplace apps let buyers and sellers discuss items over voice without sharing phone numbers. Dating apps enable users to have voice or video dates while keeping their personal contact information private until they're ready to share it.
- Global connectivity. Because calls are over the internet, users can connect with others worldwide without incurring traditional phone call charges or needing to manage country codes. In-app VoIP calls make distance irrelevant. Language learning apps connect students with tutors across continents. Remote work platforms enable international teams to collaborate as easily as if they were in the same office.
- Cost efficiency. Businesses can reduce expenses by routing calls over IP instead of using telecom carriers. There's no need to maintain expensive telephony infrastructure or pay per-minute phone charges. Customer support teams can handle calls through the app, eliminating the need for traditional call centers. Small businesses can offer phone support without investing in PBX systems or dedicated phone lines.
The Key Use Cases for In-App Calling
Many industries have embraced in-app calling.
- Social networks use it to let users have live conversations that build trust.
- Dating apps enable users to move from text chat to voice or video calls, helping them verify authenticity and build deeper connections before meeting in person.
- On-demand services (such as rideshare and food delivery) include in-app voice calls, allowing customers and drivers/couriers to coordinate without exchanging personal contact information.
- Telehealth platforms embed secure video calls for doctors and patients to have virtual consultations.
- Education and coaching apps integrate live calls for tutoring or mentoring sessions, allowing real-time instruction and personalized feedback.
- Gaming apps use group voice chat to facilitate teamwork and strategy coordination during multiplayer matches.
- Real estate platforms connect buyers with agents through video calls for virtual property tours and immediate question answering.
- Customer support tools integrate voice and video to help agents resolve complex issues more quickly than text-based support alone.
- Collaborative work platforms like Google Docs now offer voice and video calling, allowing teams to discuss edits and brainstorm ideas without needing to switch to a separate meeting app.
- Team communication tools like Slack allow coworkers to jump from message threads into huddles or video calls to quickly resolve problems that are too complex for text.
Across these scenarios, in-app calling drives deeper engagement and more efficient communication compared to external calls or text alone.
The Differences Between Voice and Video Calling
Voice calls are ideal for quick, hands-free conversations or when users are on the go. They require less attention and can easily be used with the app in the background (for example, listening and talking while multitasking).
Video calls, on the other hand, enable a richer, face-to-face interaction. They are preferred for more personal or intensive communications, e.g., a virtual therapy session, a remote dating "face-to-face" call, or a collaborative working session where seeing each other (or sharing screens) adds value. If the goal is to build trust or convey complex information (like a demo or visual aid), video can be far more effective than voice alone.
This summarizes some of the differences between voice and video in-app calls:
| Aspect | Voice Calls | Video Calls |
|---|---|---|
| Typical Use Cases | Quick conversations, on-the-go use, background-friendly (user can listen while doing other tasks). | High-touch interactions requiring personal presence (e.g., consultations, social face-to-face chats, demos). Generally, they demand the user's full attention. |
| Bandwidth Required | Low - e.g. ~80 kbps for a good quality audio stream. Tolerates weaker networks well (audio can use narrowband codecs if needed). | High - e.g. ~1.5 Mbps for 720p HD video (higher for 1080p). Requires a stable, high-bandwidth connection for smooth video. |
| Device Resources | Low impact - uses microphone and speaker. Lower battery and CPU usage. Can work in the background/with screen off (especially on mobile, similar to a music app). | High impact - uses camera, microphone, and screen. Higher battery drain and CPU/GPU usage for encoding/decoding video. Typically requires the screen to be on and the device to be held steady during a call. |
| UX/UI Considerations | Simple call UI (caller's name, profile image, call controls like mute, end call). Minimal distraction. Permissions: microphone access. | Complex UI with video windows (self-view and remote video), toggles for camera, possible layouts for multiple participants. Permissions: camera + mic access. Ensure users can easily mute video or switch to voice-only if needed. |
| Privacy Factors | Less intrusive - doesn't reveal the user's appearance or surroundings. Users may be more willing to use voice in various situations. | More personal - reveals identity and environment. Users might be selective about when to video chat (e.g., they need to be camera-ready). Providing the option to opt in for video and the ability to decline video (using voice only) is important for comfort. |
Both voice and video calling greatly benefit from in-app integration, but the choice of which to offer (or both) depends on your app's context.
Many apps provide both options. For instance, a telemedicine app might allow a patient to choose a voice call if they have limited bandwidth, or a dating app might initiate a voice call and then transition to video when both parties are comfortable.
Product managers should consider offering flexibility, allowing users to switch off video during a call or upgrade a voice call to video when desired. This ensures the calling feature is used in the broadest range of scenarios.
How In-App Calling Works
At a high level, enabling calling within an app requires a real-time communication infrastructure to be in place behind the scenes. Unlike a standard client-server request (such as fetching a web page), a call involves continuous, bidirectional media streaming with tight timing requirements.
Here are the core components and steps in a typical in-app calling architecture:
- Client Application with Media Capabilities: The app (on iOS, Android, or web) must access the device's microphone (and camera for video) and be able to capture, play, and encode/decode media streams. Technologies like WebRTC provide built-in APIs for accessing media devices and handling peer-to-peer media exchange between apps. The client app will use these APIs or an SDK to send voice/video data and render incoming media in real time.
- Signaling Server: Before two devices can start talking directly, they need to exchange call setup information (known as signaling). The signaling process handles caller/callee discovery, negotiating the call, and network information exchange. The signaling server can be a simple WebSocket or HTTP-based service that passes messages between the calling parties (for example: "User A is calling you", "User B accepted the call", or the technical details needed to establish a direct connection).
- Peer-to-Peer Media Path (WebRTC P2P): Once signaling is complete, the two apps attempt to establish a direct connection to stream audio and video between them. WebRTC was designed for peer-to-peer communication, meaning that, if possible, the media flows directly from one device to another without detouring through a server. This minimizes latency and server bandwidth costs. To achieve this, WebRTC uses techniques like STUN and ICE to discover the best path between the two devices, even if they are behind NAT routers or firewalls (a common scenario on home or mobile networks). If a direct peer connection can be established, voice and video packets travel directly between the users' devices, encrypted and in real-time.
There are nuances to this. For instance, for one-to-one calls, a peer-to-peer or single relay connection is usually sufficient. However, group calls or large conference calls require a different approach.
Suppose you simply tried to have every participant connect peer-to-peer with every other participant in a mesh. In that case, the bandwidth and processing load grow exponentially for each user (each user would send their video to every other user, which doesn't scale beyond very small groups).
To support multi-party calls, media servers come into play. The two main architectures are:
- SFU (Selective Forwarding Unit): Each participant sends their audio/video stream once to a server, and the SFU redistributes (forwards) the streams to all participants. The SFU doesn't decode or mix the media; it acts as a smart router, possibly dropping or adapting streams as needed (for example, sending lower-quality video to a user on a slow connection).
- MCU (Multipoint Control Unit): Each participant sends their stream to a central MCU server, which combines all streams into a single, mixed stream (often a composite video grid and mixed audio) and sends it back to everyone. This means each client only deals with one incoming stream.
For most modern apps, an SFU architecture is the preferred choice for group video and voice calls due to its balance of scalability and performance. One-on-one calls can often remain peer-to-peer unless recording or monitoring requirements dictate using a server.
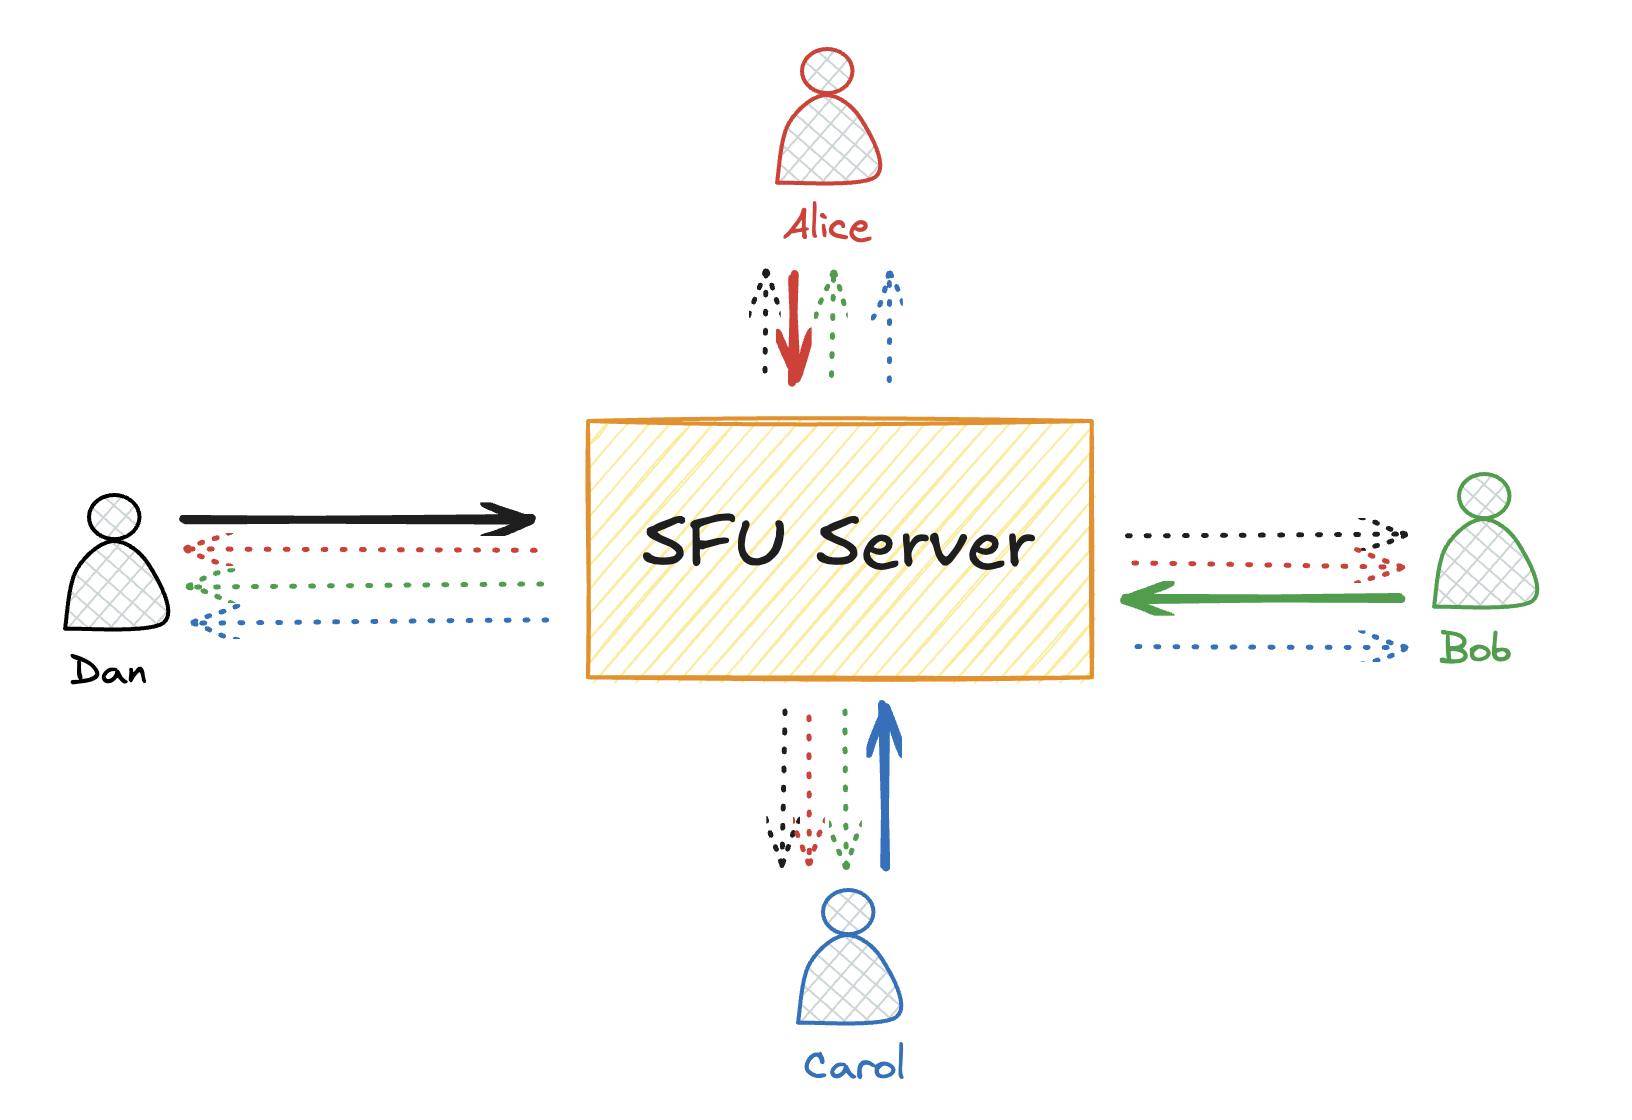
In an SFU-based group call, each participant (Alice, Bob, Carol, Dan) sends their media stream to a central SFU server a single time, and in return receives the streams of all other participants.
From a product perspective, you don't need to implement low-level WebRTC protocols yourself (unless you're building a custom solution). Many communications SDKs abstract these details.
However, it's helpful to grasp this architecture so you understand, for example, why a TURN server service might be needed (to achieve reliable connectivity globally), or why adding a 5th participant to a call might suddenly tax a user's device if you were using a mesh instead of SFU.
It also highlights why call quality can vary with network conditions -- the app is often sending data peer-to-peer over the internet, contending with real-world network issues.
Choosing an In-App Calling Solution: Build vs. Buy
One of the core decisions is whether to build the calling feature in-house using lower-level tools (like WebRTC APIs) or to use a third-party calling SDK/API.
Building with WebRTC APIs
Building directly with WebRTC gives you complete control over the implementation. You'll work with the raw browser APIs to handle media capture, peer connections, and data channels. This approach means managing your own signaling servers, implementing STUN/TURN infrastructure for NAT traversal, and writing the logic for connection negotiation, reconnection handling, and quality adaptation.
The technical complexity is significant. You'll need to handle edge cases, such as network switches, implement echo cancellation, manage codec selection, and ensure cross-platform compatibility. Your team will require in-depth expertise in real-time communication protocols and ongoing resources for maintenance as WebRTC standards continue to evolve. Expect 6-12 months for a basic implementation, with ongoing work for optimizations and new features.
This approach makes sense if you have unique requirements that existing solutions can't meet, need complete control over the media pipeline, or have the engineering resources and expertise to maintain a real-time communication system in the long term.
Building with Third-Party In-App Calling SDKs
Modern video SDKs abstract away WebRTC's complexity while providing production-ready features out of the box. The best SDKs offer simple integration - often just a few lines of code are required to add a fully featured calling experience. They handle infrastructure headaches, such as global server deployment, automatic scaling, and network optimization.
Look for SDKs that provide both voice and video capabilities in a unified video API, allowing you to start with voice and seamlessly add video later.
Quality SDKs include advanced features, such as:
- Noise suppression: Filters out background sounds like keyboard typing, construction noise, or barking dogs, ensuring only the speaker's voice comes through clearly.
- Automatic gain control: Normalizes audio levels so quiet speakers are audible and loud speakers don't blow out listeners' ears, creating consistent volume across all participants.
- Adaptive bitrate streaming: Automatically adjusts video quality based on each user's network conditions, preventing choppy calls when someone's connection drops.
- Built-in UI components that match your app's design: Pre-built but customizable call interfaces, controls, and participant views that you can style to look native to your app rather than like a bolted-on third-party widget.
- Cross-platform support with native SDKs for iOS, Android, and web frameworks: Ensures your calling feature works identically across all platforms with native performance, not just a web wrapper that feels sluggish on mobile.
The real advantage comes from features that would take months to build yourself, such as recording capabilities, real-time transcription, screen sharing, virtual backgrounds, and participant management for group calls.
Such features can be added with just a few lines of code using an SDK:
123456789<StreamVideo client={client}>
  <StreamCall call={call}>
    <StreamTheme>
      <SpeakerLayout participantBarPosition="bottom" />

      <CallControls />
    </StreamTheme>
  </StreamCall>
</StreamVideo>;
Good providers also handle compliance requirements like HIPAA for healthcare or regional data residency. You can launch in weeks instead of months, iterate quickly based on user feedback, and rely on the provider's expertise for optimization and new features.
Integrating In-App Calling with Your App's User Experience
A great in-app calling feature must be woven into your app's UX. Here's what matters most:
- Entry Points and Discovery. Place call buttons where users naturally expect them - in chat headers, user profiles, or support sections. Use familiar icons (such as a phone for voice and a camera for video) with clear labels. Maintain consistent placement throughout your app to help users develop muscle memory. Consider the user's context: a "Call Support" button makes sense on error screens, while peer-to-peer calls belong in conversation flows.
- Permission Management. Show a friendly pre-permission screen explaining why you need microphone/camera access before triggering system dialogs. When users deny permissions, don't fail silently. Instead, provide clear next steps, such as "Enable microphone in Settings to start calling." Consider progressive disclosure: request microphone permission for voice calls first, then camera permission only when they attempt to use video.
- In-Call Interface. Design for clarity under pressure. Users need to quickly find mute, speaker toggle, and end call buttons without thinking. For video calls, default to full-screen remote video with a draggable picture-in-picture self-view. Auto-hide controls after a few seconds, but make them easily accessible with a tap. Use obvious visual indicators - a red slash through a muted microphone, a pulsing border when someone's speaking.
- Incoming Call Handling. Leverage native call UI frameworks (iOS CallKit, Android ConnectionService) to make your calls feel like system calls - appearing on lock screens with swipe-to-answer. For in-app notifications, display who's calling and provide clear accept or decline options. Handle edge cases gracefully: what happens if the user's on another call, if the app crashes during ringing, or if the network drops during connection?
- Quality and Feedback Loops. Add subtle quality indicators during calls - connection strength bars or "Poor connection" warnings help users understand issues aren't your app's fault. Post-call, gather feedback with a simple star rating or "Report a problem" option. For support calls, follow up with "Was this resolved?" to measure effectiveness. Use this data to improve both technical performance and UX patterns.
- Privacy and Control. Give users control over who can call them - options like "Contacts only," "Nobody," or granular block lists. For business apps, consider availability settings or office hours. Make it easy to report abuse or spam calls. These controls build trust and prevent your calling feature from becoming a channel for harassment.
The best calling experiences feel native to your app while respecting platform conventions. Test with real users in real network conditions. A beautiful UI means nothing if calls fail or feel awkward to initiate.
Transform Your App with Voice and Video
In-app voice and video calling transform how users communicate within your product, creating richer interactions that drive engagement and retention.
The key is choosing an approach that matches your resources and timeline. While building with raw WebRTC offers ultimate control, modern SDKs provide a faster path to production with enterprise-grade features, such as noise suppression, cross-platform support, and built-in UI components that feel native to your app.
No matter which route you choose (building from the ground up or using an SDK), understanding the architecture, user experience considerations, and trade-offs of in-app calling will help you make informed decisions.