When dealing with internet video calls, many things can negatively impact call quality. Improving call quality when issues occur requires understanding how specific metrics impact your user’s experience. To help you better understand what is going on, Stream offers a comprehensive video statistics page on our dashboard. With our statistics dashboard, you can quickly inspect overall call quality and, when needed, get enough information to dig into an issue using Chrome's Built-in WebRTC Debugging Tools.
Before we look at the available tooling, let’s first look at the most important metrics impacting call quality.
Understanding Key Call Quality Metrics
When implementing WebRTC calls in your application, monitoring several critical metrics is essential for maintaining high-quality communication. Let's examine these metrics, their significance, and how to monitor them effectively.
Latency Round Trip Time (RTT)
Latency is the time taken for data to travel from sender to receiver and back. It's one of the most crucial metrics affecting real-time communication.
- Acceptable ranges:
- Excellent: \< 100ms
- Good: 100-150ms
- Poor: > 150ms
- Detection methods:
- Monitor RTT values from getStats() API
- Implement RTCP sender/receiver reports
- Track end-to-end delay measurements
Jitter
Jitter represents the variation in packet delivery time, which can cause audio/video quality issues.
- Acceptable ranges:
- Excellent: \< 20ms
- Good: 20-50ms
- Poor: > 50ms
- Detection methods:
- Analyze packet arrival time variations
- Monitor jitter buffer metrics
- Track packet inter-arrival time
Time to Connect
This metric measures how long it takes to establish a WebRTC connection, including ICE candidate gathering and signaling.
- Key components to monitor:
- ICE gathering time
- Signaling round-trip time
- DTLS handshake duration
- Detection methods:
- Log timestamps for connection state changes
- Track ICE candidate collection times
- Measure time from offer to answer completion
Codec Performance
The choice and performance of audio/video codecs significantly impact call quality and resource usage.
- Key metrics to monitor:
- Encoding/decoding time
- Bandwidth consumption
- CPU usage
- Frame rate and resolution adaptation
SFU Performance
When using Selective Forwarding Units, additional metrics become important:
- Critical measurements:
- Server CPU and memory usage
- Number of concurrent connections
- Bandwidth utilization per connection
- Server-side packet loss and jitter
Impact on User Experience
These technical metrics directly translate to user experience in several ways:
- High Latency Effects:
- Delayed responses leading to awkward conversations
- Audio/video synchronization issues
- Increased frequency of talk-overs
- Jitter Impact:
- Choppy or robotic audio
- Frozen or stuttering video
- Lip-sync problems
- Connection Time Issues:
- User frustration during call initiation
- Increased call abandonment rates
- Poor first-time user experience
Monitoring Solutions
To effectively track these metrics, implement a combination of:
- Real-time monitoring using WebRTC's getStats() API
- Server-side logging for SFU performance
- Client-side analytics for user experience metrics
- Automated alerting systems for threshold violations
By implementing comprehensive monitoring of these metrics, developers can proactively identify and resolve issues before they significantly impact user experience.
Chrome's Built-in WebRTC Debugging Tools
Chrome provides powerful built-in debugging tools for WebRTC connections through chrome://webrtc-internals. This interface offers developers deep insights into the real-time performance and behavior of WebRTC connections, making it an invaluable resource for troubleshooting and optimization.
While the tool presents comprehensive data about connection statistics, codec negotiations, and network parameters, the sheer volume of information can be overwhelming. Many developers find that only a small subset of the available metrics — such as packet loss, jitter, and bandwidth usage — are regularly useful for debugging common issues. The challenge lies in identifying which metrics are relevant for your specific debugging scenario among the vast amount of data presented.
Stream Dashboard: Real-time Call Analytics

- Comprehensive Metric Overview
- Simplified dashboard interface focusing on key call metrics like Call Rating, Latency Average and Jitter Average.
- Real-time monitoring and historical data analysis
- Interactive Call Timeline Features
- User Events: Join/leave timestamps, mute toggles, screen sharing
- Network Events: Connection quality, resolution changes, codec switches
- Visual correlation between events and quality metrics
By combining the statistics in Stream’s Video Dashboard you will be able to gauge how users experience their video calls. Whenever you notice issues, you can seek out the network conditions that caused these issues, allowing you to quickly determine whether this is an incident or something that requires more attention.
Let’s Try the Stream Video Stats Dashboard
The other day, Backend Engineer, Suchith and I were in a video call discussing the Stream Video dashboard. At some point, we noticed that one of us started to look really pixelated.
Time to open up the Stats Dashboard a have a look.
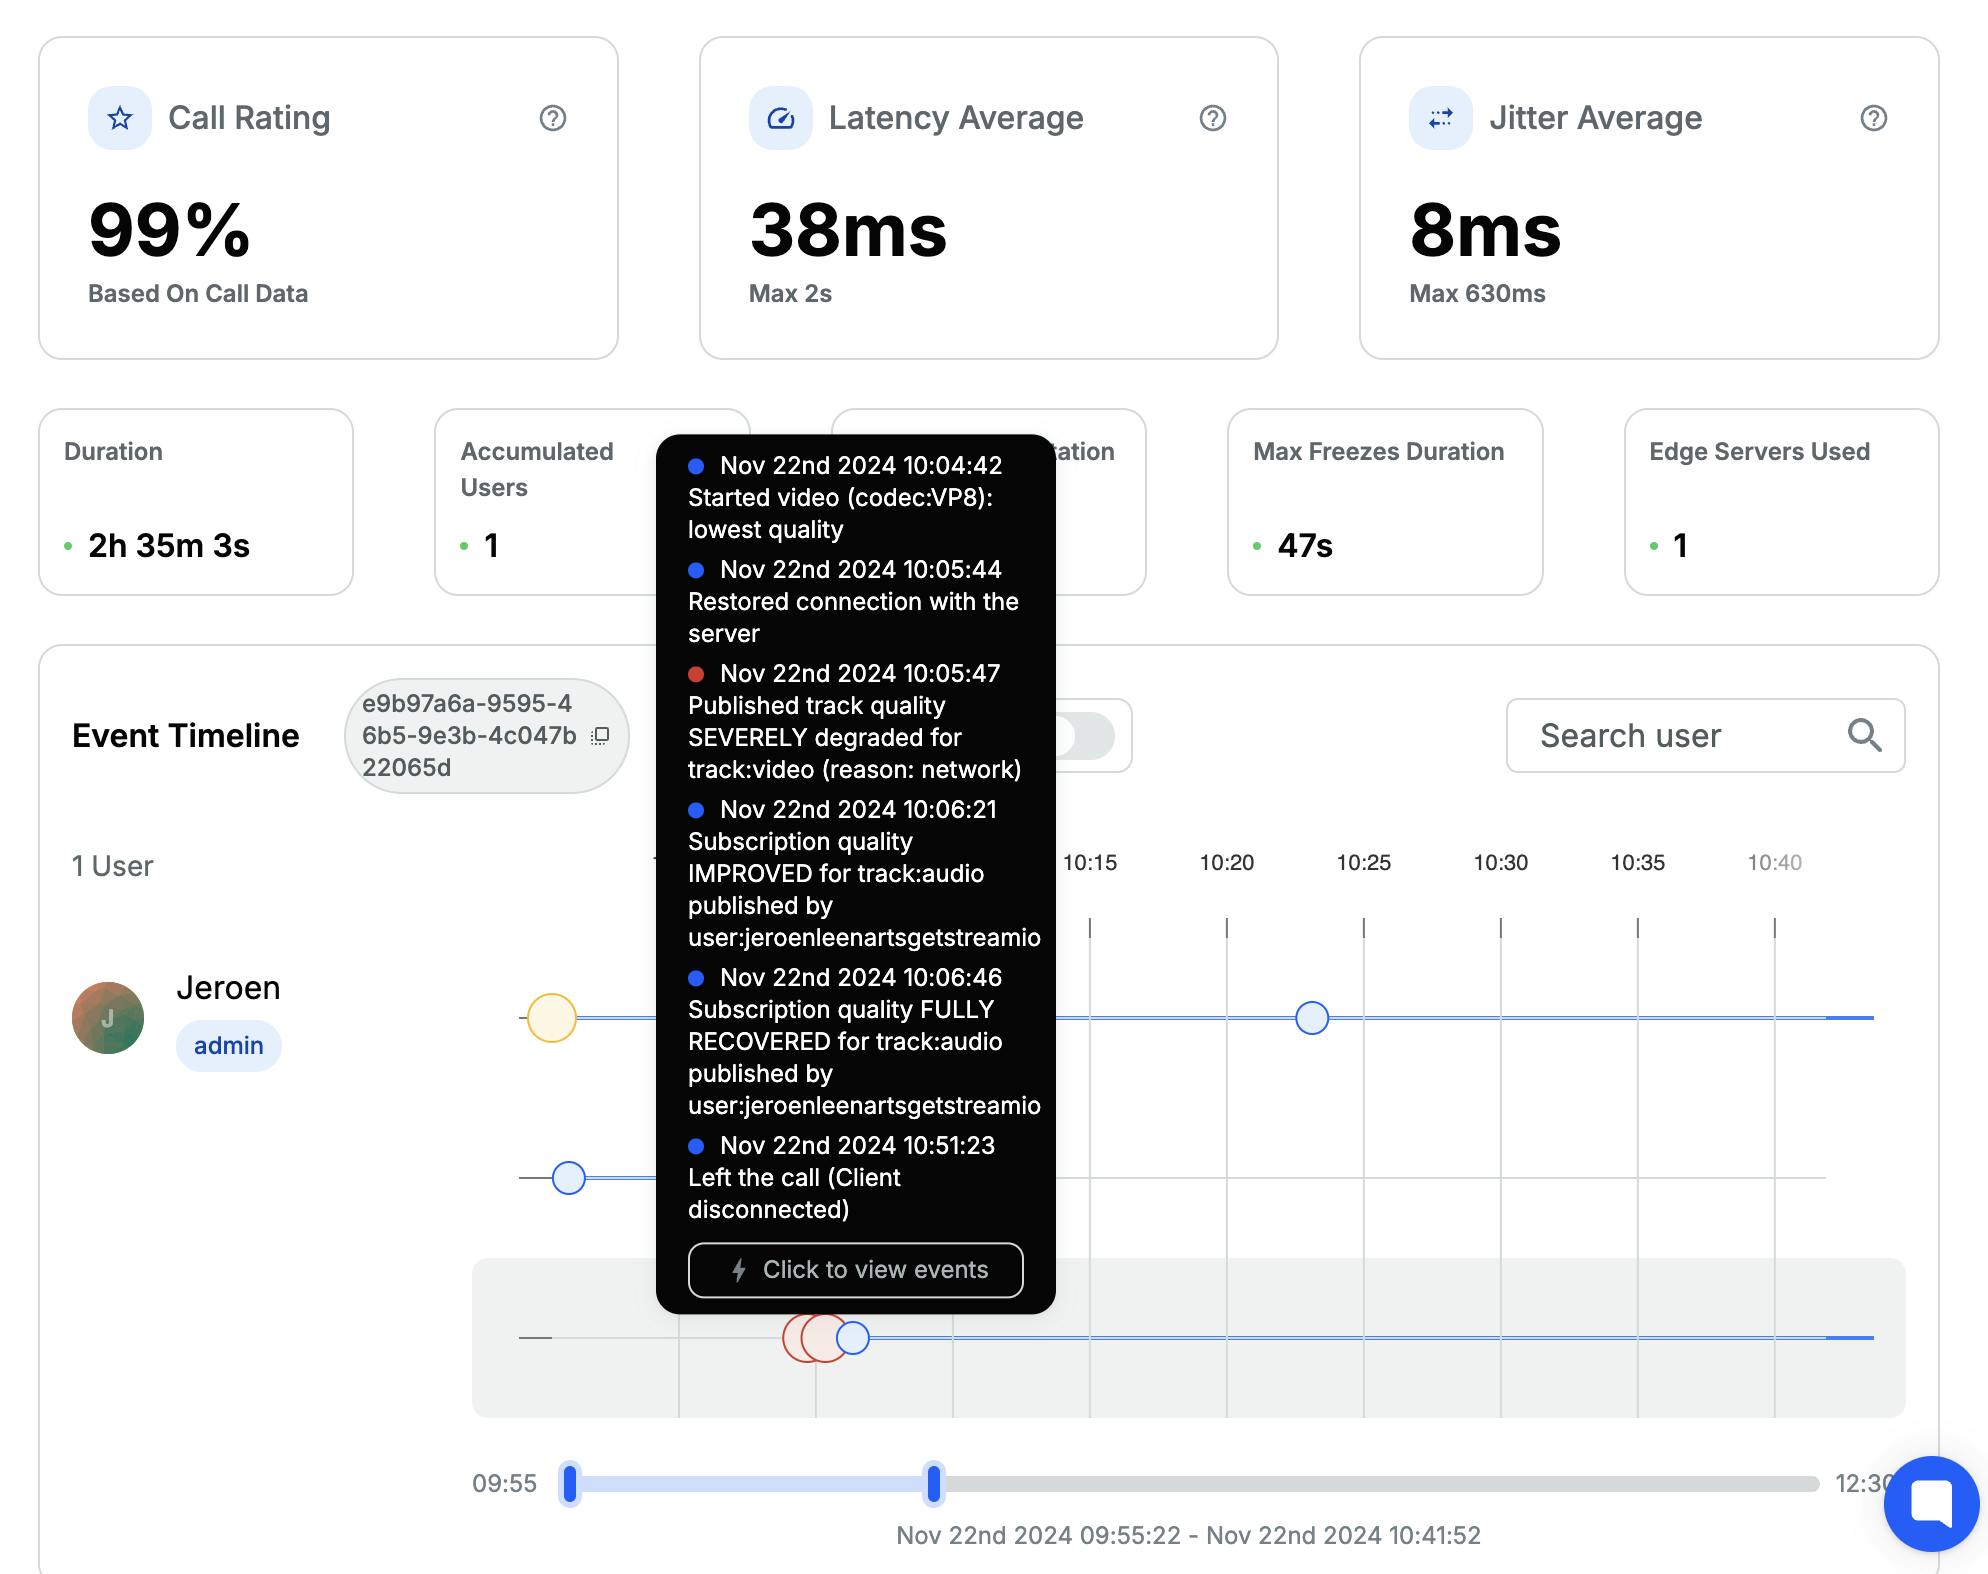
Looking at the overall call quality, everything seemed fine good at first glance—the call’s rating is nice and high, with latency and jitter relatively low.
There are some indicators on the timeline, though.
Let’s look a bit closer at those.
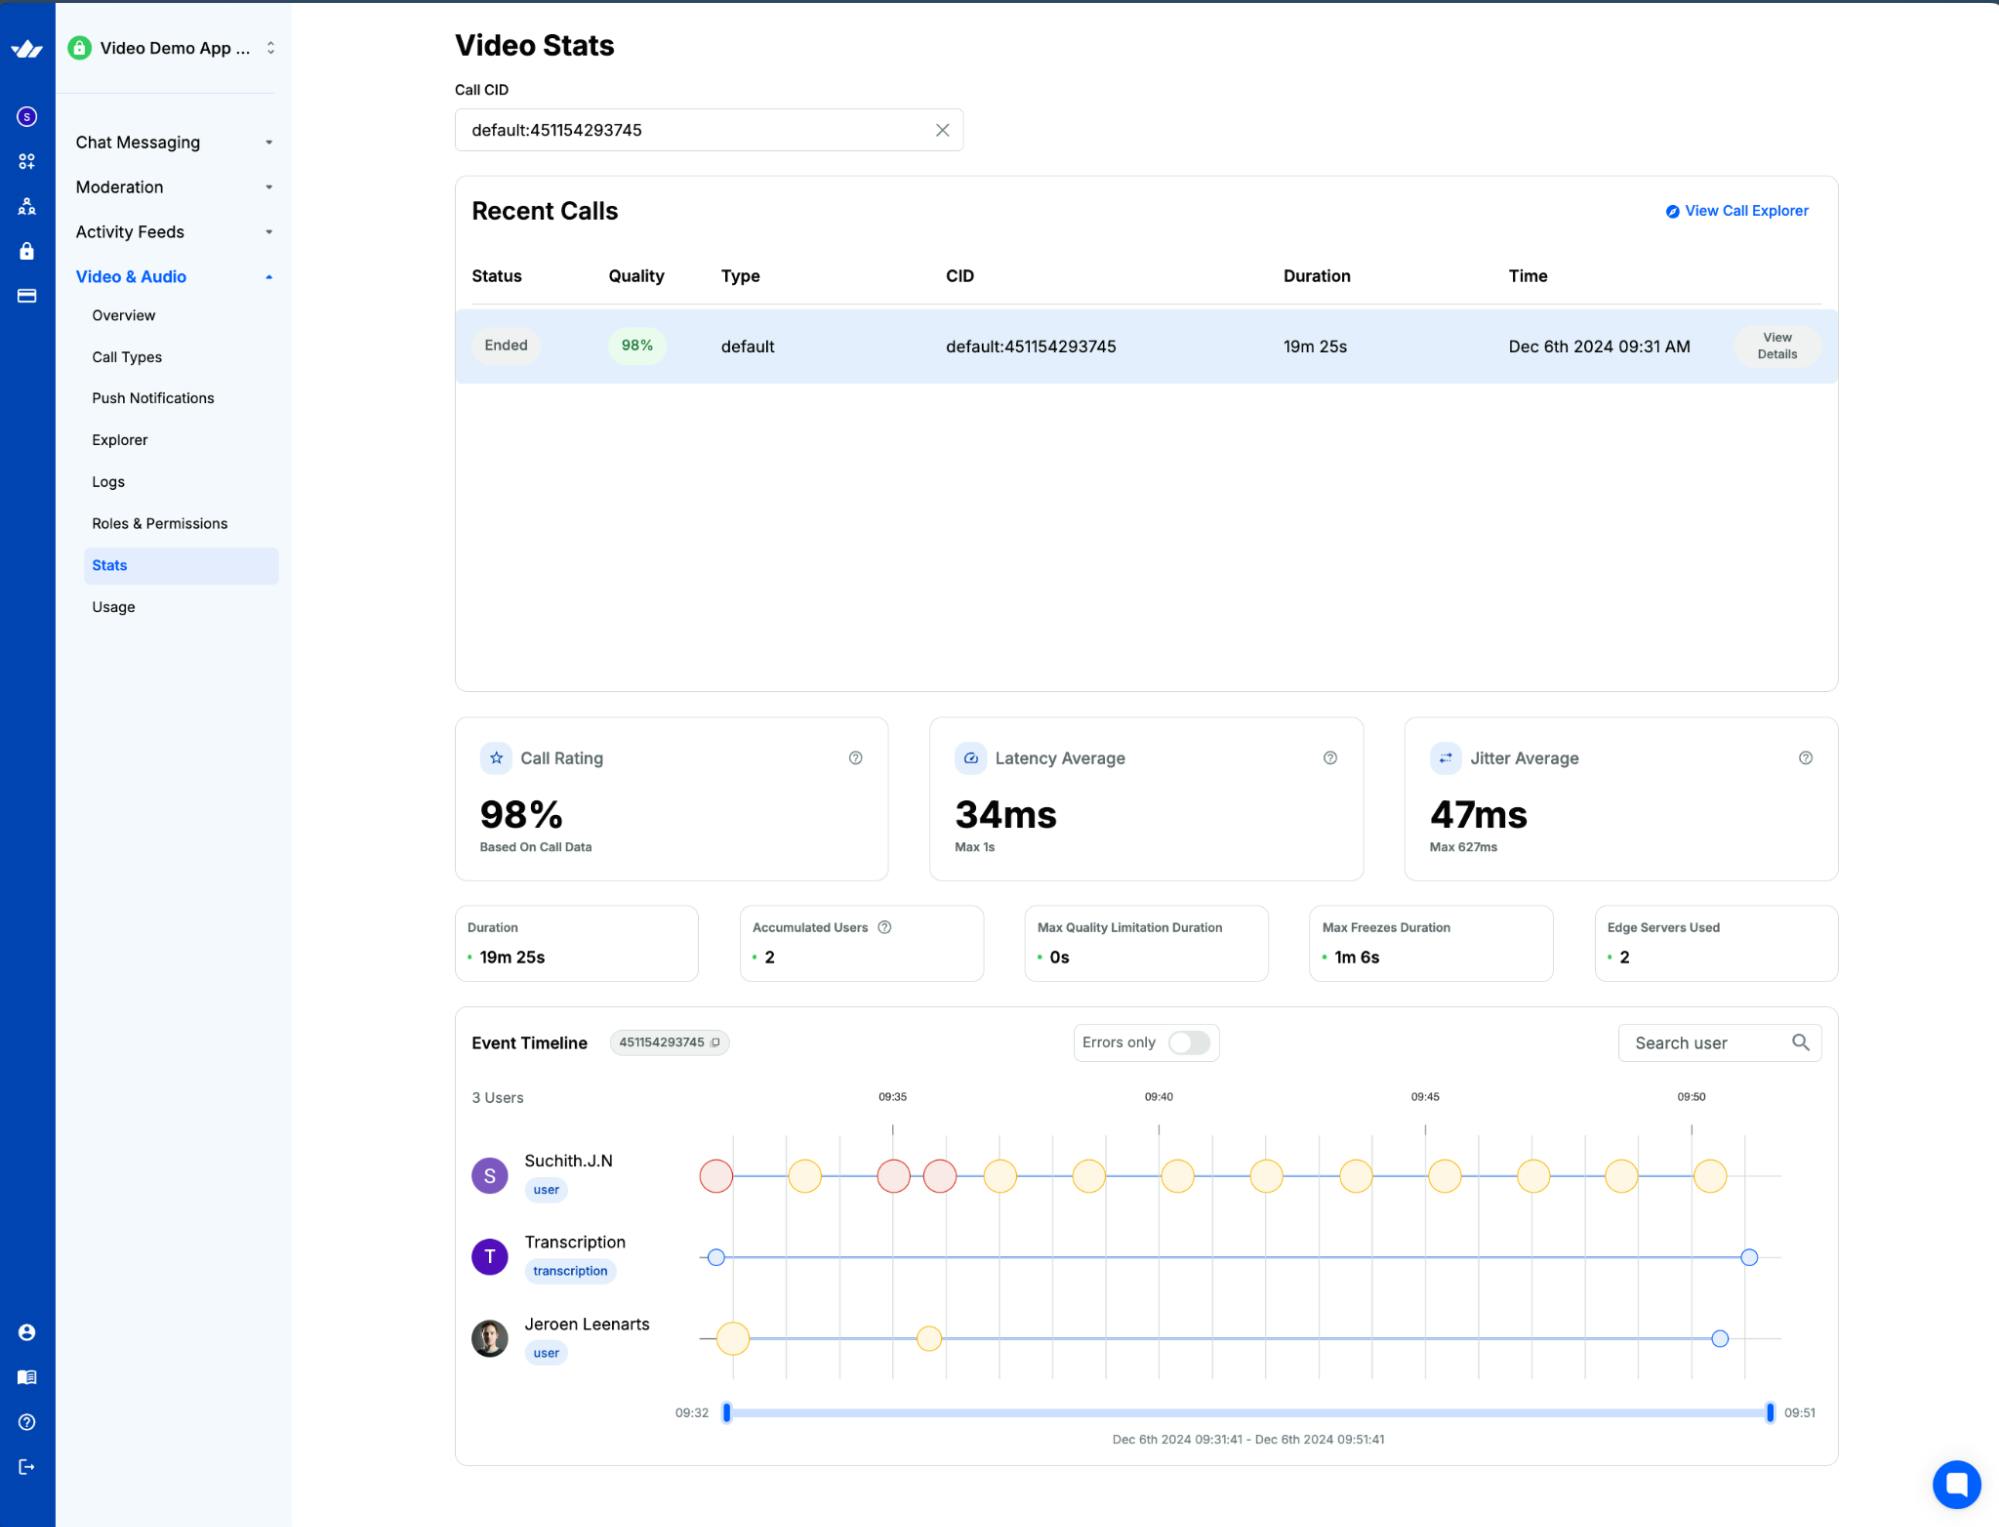
Move your mouse cursor to hover over the colored circles on the timeline.

This information about the quality of the video I am sending is on Suchith's call timeline.
That’s interesting. Why would Suchith receive a deteriorated feed? This could be related to something going on at Jeroen, but at the top, there’s also a message about Suchith’s publish quality being limited due to bandwidth. So this might actually have something to do with the speed of the internet connection between Suchith and me.
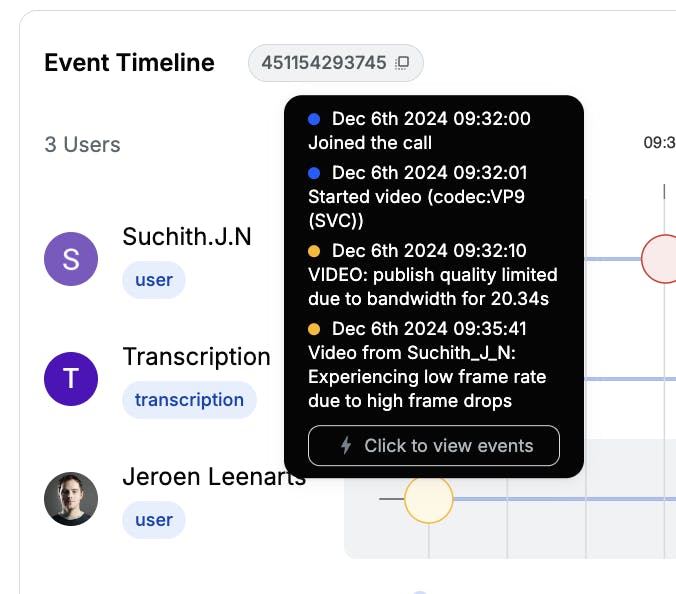
My timeline indicates that I am receiving low frame rates from Suchith. So, it might be related to his uplink connection. I cannot see how his uplink is working, but I can check my end of the situation.
I quickly click on that yellow circle from the previous screenshot.
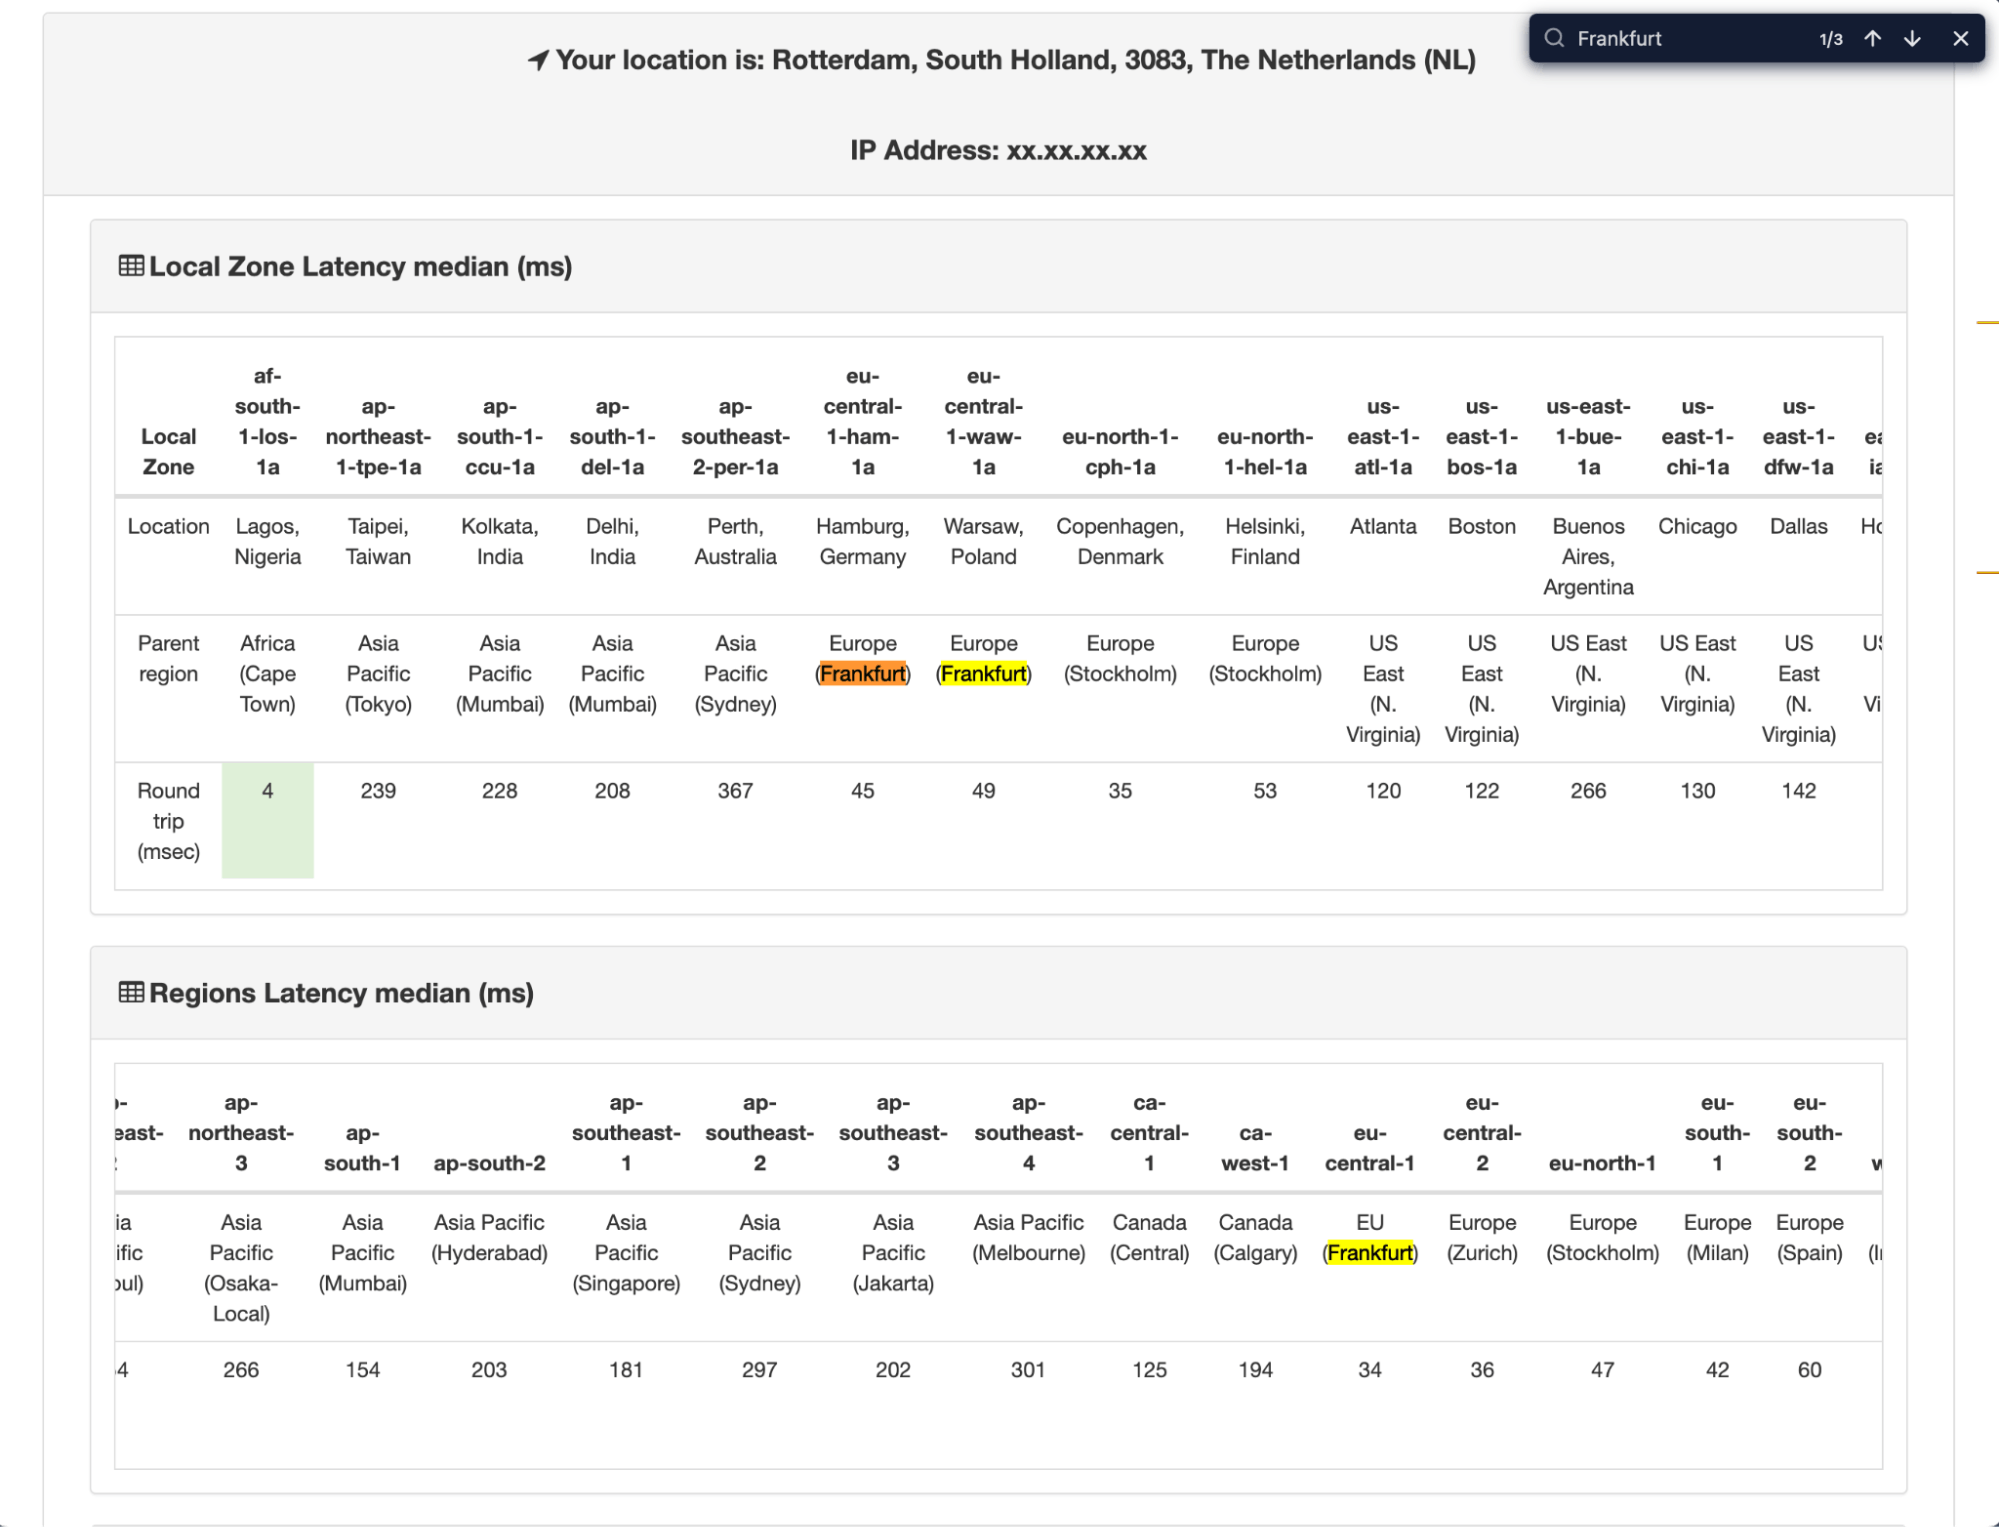
And from the “device” tab I can see I am probably connecting to AWS Frankfurt.

Let’s open up a site like https://aws-latency-test.com/.
On that page, I see that I am getting decent enough connectivity to Amazon’s Frankfurt data centers.
I quickly informed Suchith of my findings. He then told me he was playing with Apple’s Network Link Conditioner to ensure we had some interesting results on the stats dashboard.
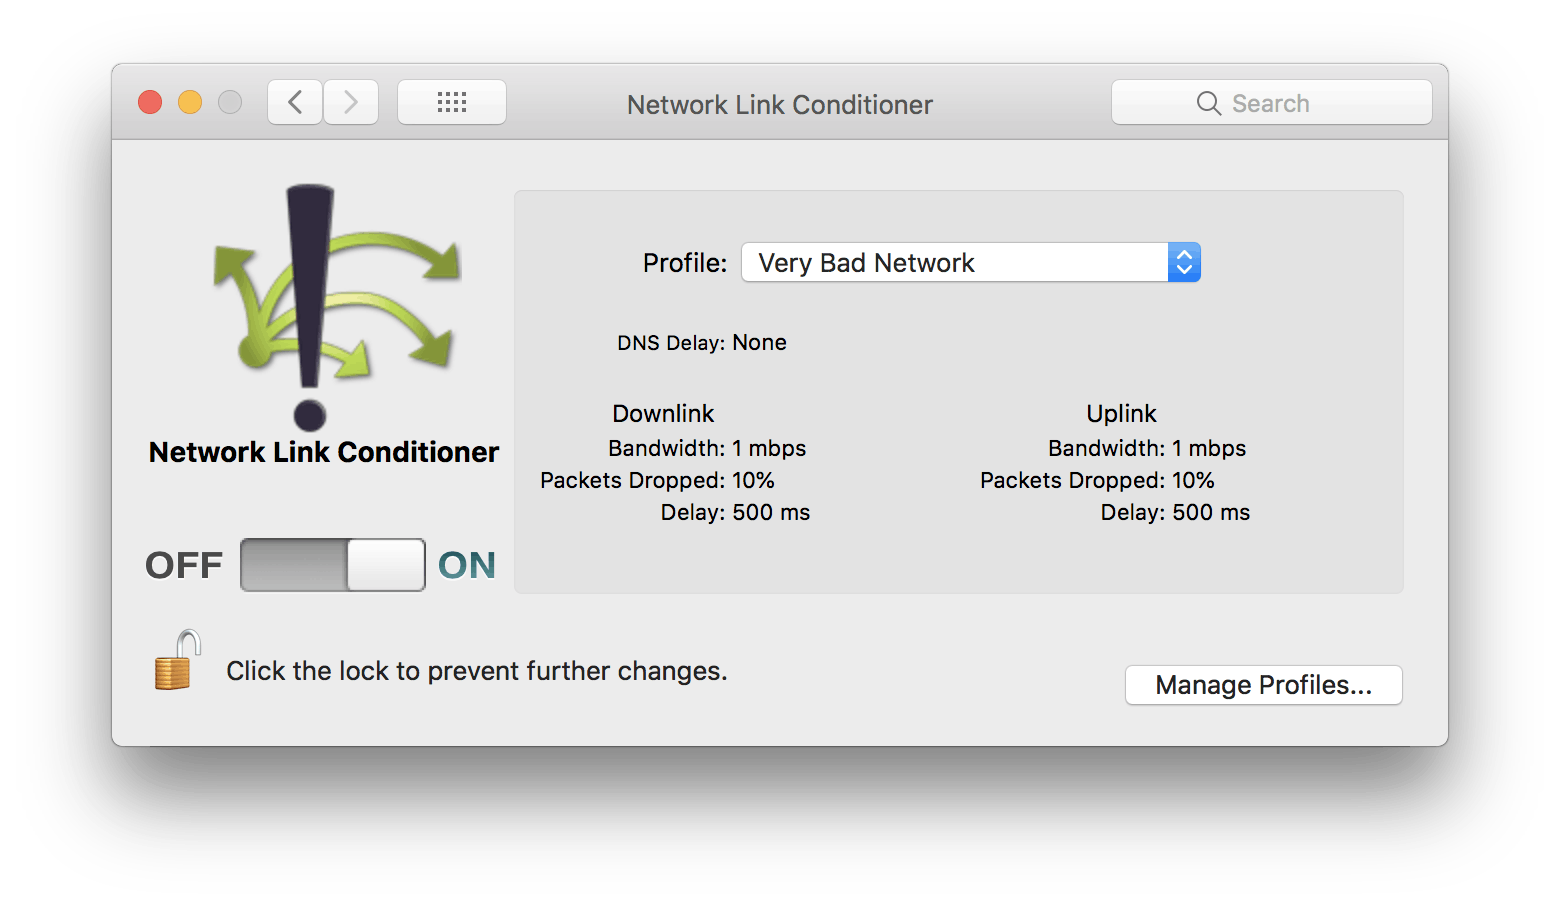
Soon after Suchith turned off the Network Link Conditioner, our call experience improved quickly—but apparently not enough to satisfy Stream’s system.
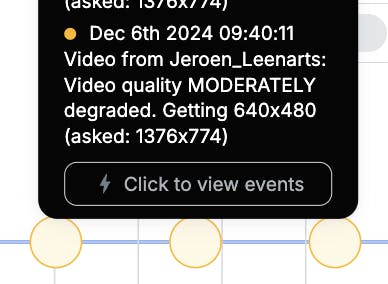
My video was still degraded, but that was something I could explain. I was working over my cellphone, and my reception was somewhat deteriorated due to the environment I was sitting in.
As you can see, with a bit of common sense, you can derive a lot of information from the Video Stats page. Above all, don’t just look at the raw data and assume things are bad. More often than not, the call quality is great even in higher latency, or situations with loads of network jitter.
Experiment and assume. Once you have found something that needs some deeper inspection, have a look at our Debugging WebRTC Calls article. It provides more information on how you can inspect a video call from the participant's perspective right down to the protocol level.
Collecting Feedback From Users
Direct user feedback is invaluable for understanding call quality from the end-user perspective. Stream's user ratings API provides a powerful way to collect this feedback systematically. The API enables developers to implement rating prompts at the end of calls, where users can rate their call experience on a scale, provide detailed written feedback, and report specific issues they encountered.
The feedback collection process is seamlessly integrated into Stream's dashboard, providing developers with:
- Comprehensive user satisfaction metrics and trends
- Correlation analysis between user feedback and technical performance data
- Pattern recognition in reported issues
- Actionable insights for quality improvements
The user ratings API is designed with flexibility in mind, allowing developers to:
- Customize rating scales and feedback forms
- Match the rating interface with their application's design
- Collect both quantitative and qualitative feedback
- Track feedback across different user segments and call types
Here's an example of how to implement the user ratings API in React:
123456789101112131415161718192021222324252627import { useCallStateHooks } from '@stream-io/video-react-sdk';

const CallQualityRating = () => {
  const { useCallRating } = useCallStateHooks();

  const handleRating = async (rating, feedback) => {
    try {
      await call.rateCall(rating, feedback);
      console.log('Call rating submitted successfully');
    } catch (error) {
      console.error('Error submitting call rating:', error);
    }
  };

  return (
    <div>
      <h3>Rate your call experience</h3>
      <button onClick={() => handleRating(5, 'Great call quality!')}>
        Rate 5 stars
      </button>
      <textarea
        placeholder="Share your feedback..."
        onChange={(e) => setFeedback(e.target.value)}
      />
    </div>
  );
};
This is a basic example - you can customize the UI and rating system according to your application's needs while still utilizing Stream's rating API to collect and track user feedback.
Ready to Transform Your Video Experience?
WebRTC has many metrics that you can look at. Developers using Stream have a comprehensive set of tools and a dashboard to quickly examine the health of their calls and get user feedback on how things are going. They can use these tools to detect integration issues, user connection issues, etc., and then optimize their apps to minimize interruptions.
Experience the power of enterprise-grade WebRTC with Stream's comprehensive video, voice calling, and livestreaming solution. Our robust monitoring tools, intuitive dashboard, and expert support team ensure your video integration succeeds from day one. Whether you're building a virtual classroom, telehealth platform, or social app, Stream Video provides the reliability and performance your users demand.
Ready to elevate your app with crystal-clear calls? Create your free account today or connect with our team to discover how Stream can transform your video calling user experience.

