

Even if you think metrics are boring, you know that they're essential. Product metrics are your window into all the critical touch points along the customer lifecycle. They help you contextualize the customer experience for your team and provide insight into how your products impact both customers and your business.
Understanding which product metrics to focus on can be tricky. If you focus on the wrong thing, you'll never be able to gain a deeper level of understanding of your customers. The right metrics help you learn more about the various ways customers interact with your product and how those interactions build into an engaged and long-lasting relationship with your customers.
By understanding these relationships better, you're able to anticipate customer needs easier, which means you can build products that solve their problems proactively. And when you do that, you're not just helping customers accomplish their goals. You're making it easy for them to see your product's value, which is at the core of building a sustainable and profitable business.
1. Monthly Recurring Revenue (MRR)
Monthly recurring revenue (MRR) is a measure of the revenue you bring in on a monthly basis. It's a core metric for understanding your business's overall health and helps you track how customer growth adds value to your business. Tracking MRR enables you to see how various changes to your pricing or customer acquisition impact your overall revenue.
Fluctuations in MRR are also an indicator of your ability to provide value to customers. An increase in MRR means you've acquired more customers or that your current customers have increased in value. Either situation means that you're actively providing more value to customers with your product.
But the inverse is also true. Decreasing MRR is a lagging indicator of potential issues with your product, whether it's due to churn or downgrades. When you track downturns in MRR, it helps you see which customers are unhappy with your product.
2. Lifetime Value (LTV)
Lifetime value (LTV) is another revenue-based product metric: it shows you the total amount of revenue you gain from a single customer over time, averaged across your entire customer base. Tracking LTV helps you build more realistic buyer personas and helps you see the different value users provide to your business based on their account type or purchasing power.
In general, customers with a higher LTV are more valuable for your business. We're not saying that you should ignore customers with a lower LTV, just that the people who have a higher LTV help you increase MRR faster when you acquire them.
Use this product metric to identify and refine your target buyer personas. Let's say you have three pricing tiers: Basic, Premium, and Enterprise. Customers coming in on your Basic tier will likely have a lower LTV than those in Premium or Enterprise, but you'll also have more of those Basic users, and they'll be easiest to acquire. Building out your customer base around these tiers is a balancing act between the volume of accounts and their overall value to your business.
3. Customer Acquisition Cost (CAC)
Customer acquisition cost (CAC) is a measure of how much your business pays to bring in new customers. It can include the costs of marketing campaigns, paying employees, and advertising budget: anything your company puts out, whether it's time or resources, to bring in new leads.
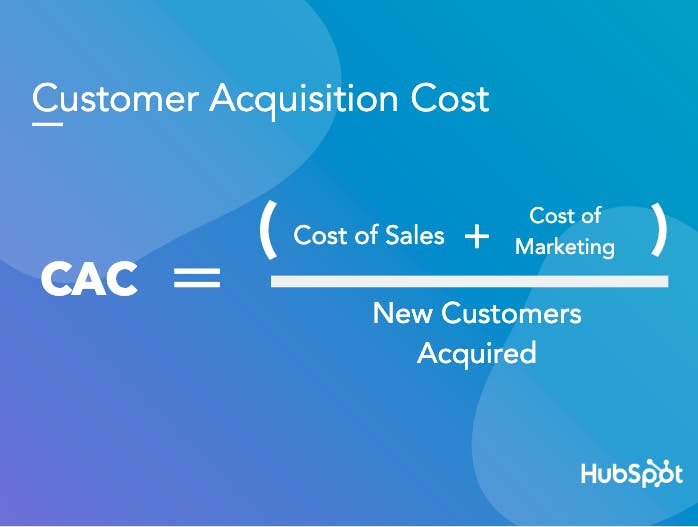
Customer acquisition cost formula via HubSpot.
Similar to LTV, CAC is usually segmented based on your different customer personas. Using our three-tier example from earlier, customers purchasing the Basic plan will likely have a lower CAC than those on Premium or Enterprise because the higher-priced accounts need more convincing to make their purchase decision. Understanding these differences helps you maximize your spend to bring in the most LTV for the least CAC.
Increases in CAC usually indicate issues with your lead funnel or the perception of your company in the market. Suppose you're finding it more expensive to bring in the same accounts as you did previously. In that case, it's time to evaluate your product positioning and messaging to ensure it's aligned with customer expectations, needs, and desired outcomes.
4. Average Revenue per User (ARPU)
Average revenue per user (ARPU) is another useful product metric for conceptualizing how your customers add value to your business. Less segmented than LTV, ARPU is a measure of the average revenue you bring in on a per-user basis. And it helps you identify trends in customer behavior based on price changes, feature releases, and expansion revenue.
To calculate ARPU, just divide your MRR by the total number of users you have. Think about it as a baseline product metric for tracking how valuable your users are in relation to your product. You'll see the differences between LTV and CAC based on your ARPU and use that to inform your product development and marketing campaigns as your company evolves.
If you see a decline in ARPU, that might signal an increase in accounts with a lower LTV or an increase in churn. This knowledge helps you adjust your product strategy and positioning to acquire more high-value customers, for example.
5. Customer Satisfaction (CSAT)
Customer satisfaction (CSAT) measures how happy people are with your product. While customer support teams also use it to track their interactions with different people, this product metric is a great way to identify potential pain points along the customer journey.
Just know that CSAT is colored by the interactions people have with both your product and your team, making it easier to conceptualize the product experience as a whole. A higher CSAT tells you that your customers are more engaged with the product and can easily see the value it provides, which generally means there's less churn potential.
Decreases in CSAT indicate unhappy or struggling customers. Use that as a jumping-off point for product discovery and targeted outreach. While the people who are dissatisfied with your product may be so for a number of unrelated reasons, you can count on their open and honest feedback.
6. Net Promoter Score (NPS)
Net promoter score (NPS) helps you measure customer loyalty. And it does this by asking a simple question. "On a scale of 1 to 10, how likely are you to recommend this product to others?" It helps you gut-check how current customers feel about your product, whether it's a new feature release or a long-term offering.
The NPS survey categorizes people into three categories based on their scores:
- Promoters: People who score your product a 9 or 10
- Passive: People who score your product a 7 or 8
- Detractors: People who score your product a 6 or below
Promoters are your brand advocates, Passives are likely your regular customers, and Detractors are actively unhappy with your service. This breakdown makes it easy to prioritize your outreach to speak directly with people who aren't getting what they need from your product.
When you average these scores, it helps you gain a general sense of how well your product solves problems for your target audience. NPS is short-hand for having conversations about your overall product development strategy and its impact on your customers.
7. Churn Rates
Churn comes in two types: customer churn and revenue churn. Both of these product metrics are important for product managers and owners to understand, because a decrease in one will likely lead to a decline in the other. And those decreases have a direct impact on your health as a business.
Customer churn
Customer churn looks at the loss of customers on a monthly and yearly basis. It provides insight into the customer experience and helps you understand how people feel about their product experiences. Use this product metric to frame conversations about how your product solves problems for a customer or meets their needs.
Let's say you see an increase in churn for customers upgrading from a Basic plan to a Premium one. That would likely indicate that the perceived ROI of spending more money on your product didn't match up with those customers' experiences. Use that knowledge to revisit your pricing tiers and test out different product or feature differentiation strategies to nail down the problem.
Revenue churn
Revenue churn is a measure of the amount of money lost due to customer churn. Understanding how customer churn impacts revenue churn is one of the first steps toward building your knowledge of how pricing and positioning changes affect your bottom line.
Revenue churn is a leading indicator of company health issues: it tells your team that there are decreases in MRR, which can signal issues for other product metrics like LTV and ARPU. That's why you need to look at how your revenue fluctuates based on changes to your product experience.
8. Engagement Rates
Engagement is a measure of how customers interact with your product, your website, and your team. Understanding engagement rates helps you identify potential friction in the product experience and track the impact of changes to your marketing campaigns and onboarding flows.
Product managers should pay attention to two main types of engagement: website engagement and user engagement.
Website engagement
Tracking website engagement is the best strategy you have for conceptualizing the customer journey. It shows you how consumers become leads or potential customers and provides insight into the various ways users interact with your company online.

Example customer journey map via Taplytics.
Let's say you're working with new customers in the onboarding process and know that once they reach the Account Details page for the first time, they're pretty much all set up. Tracking engagement with key pages and actions along the way helps you see how much time it takes for new customers to get acquainted with their account as well as any issues they experience.
Understanding website engagement also helps you track your marketing campaign's effectiveness by highlighting the pages that drive the highest conversion rates.
User engagement
User engagement looks at the experience of interacting with your product. It highlights how different people perceive your product's value and can surface potential issues that lead to friction. This knowledge helps you build more realistic user personas based on the different experiences people have with your product.
Tracking user engagement also helps you understand what kinds of resources provide the most support for new or struggling customers. Some people will need more of a helping hand to realize the value your product provides, and a decrease in user engagement is a great signal to identify those users.
9. Active Users
Tracking active users daily, weekly, or monthly helps you keep tabs on product adoption and engagement. This product metric pairs well with user engagement to highlight how product usage fluctuates over time based on a number of different factors.
For example, tracking daily active users (DAU) is the best way to see the impact of changes to the product experience after a feature release. Weekly active users (WAU) steps back a little bit to give you a broader view of how engagement with your product increases or decreases over time. Tracking these metrics helps you to see where to provide support or reach out to customers and remind them of your product value.
Monthly active users (MAU) takes another step back and helps you visualize product adoption rates on a macro scale. When you use all three metrics together, it helps your team hone the path from product adoption to engagement to build loyal relationships over time.
10. Time to Value (TTV)
Time to value (TTV) helps you measure how long it takes for new users to experience your product's value fully. Think about it as the time it takes for someone to move from purchasing your product to becoming an engaged, active user. Use this product metric to refine the customer experience and gain insight into how your onboarding and educational efforts teach customers what they need to succeed with your product.
Reducing TTV helps you increase LTV by cutting down on churn potential and helping customers get value from using your product quickly. And it helps you better understand your revenue model because you'll be able to track how long it takes for someone to move from a new user to an engaged brand advocate.
When you include this product metric in your customer lifecycle management strategy, it helps you identify critical touchpoints in your customer relationships and provide the kind of support that people need to grow alongside your product.
Product Metrics Help You Refine the Customer Experience
Product metrics show you how your actions impact the customer. This insight not only helps you gain a deeper understanding of the customer experience but also helps your team build empathy with the problems your customers face daily. That empathy makes it easier to anticipate evolving market needs and create the type of product experience that strengthens relationships with your customers.