

In our previous article, we discussed setting up your stream chat application with advanced search features using Elasticsearch. In this article, we will combine this power tool with visualization software to enhance our chat application’s features and capabilities.
(Note: This guide assumes some familiarity with Node.js, Docker, and basic command-line usage.)
Combining Stream Chat, Elasticsearch, and Kibana gives us the following:
- Instant Chat: Stream Chat handles user presence, real-time updates, push notifications, etc.
- Powerful Visualization: Kibana turns raw chat messages into line charts, bar graphs, or real-time dashboards.
- Search & Analytics: Elasticsearch indexes your messages for full-text search, advanced aggregations, and near-real-time queries.
If you followed along in the first article, hurray! You have built your (first) chat application or system. But, the success of a product or application lies heavily on how much or how far it is being used. A good way to know this is to collect and analyze usage data. This is where we introduce Kibana's power through Stream Chat!
By combining these tools, you can:
- Monitor message volume over time.
- Identify top users or channels quickly.
- Catch anomalies or suspicious spikes in chat traffic.
This tutorial walks you from Node.js code that captures Stream Chat webhooks to Kibana dashboards that bring your chat data to life.
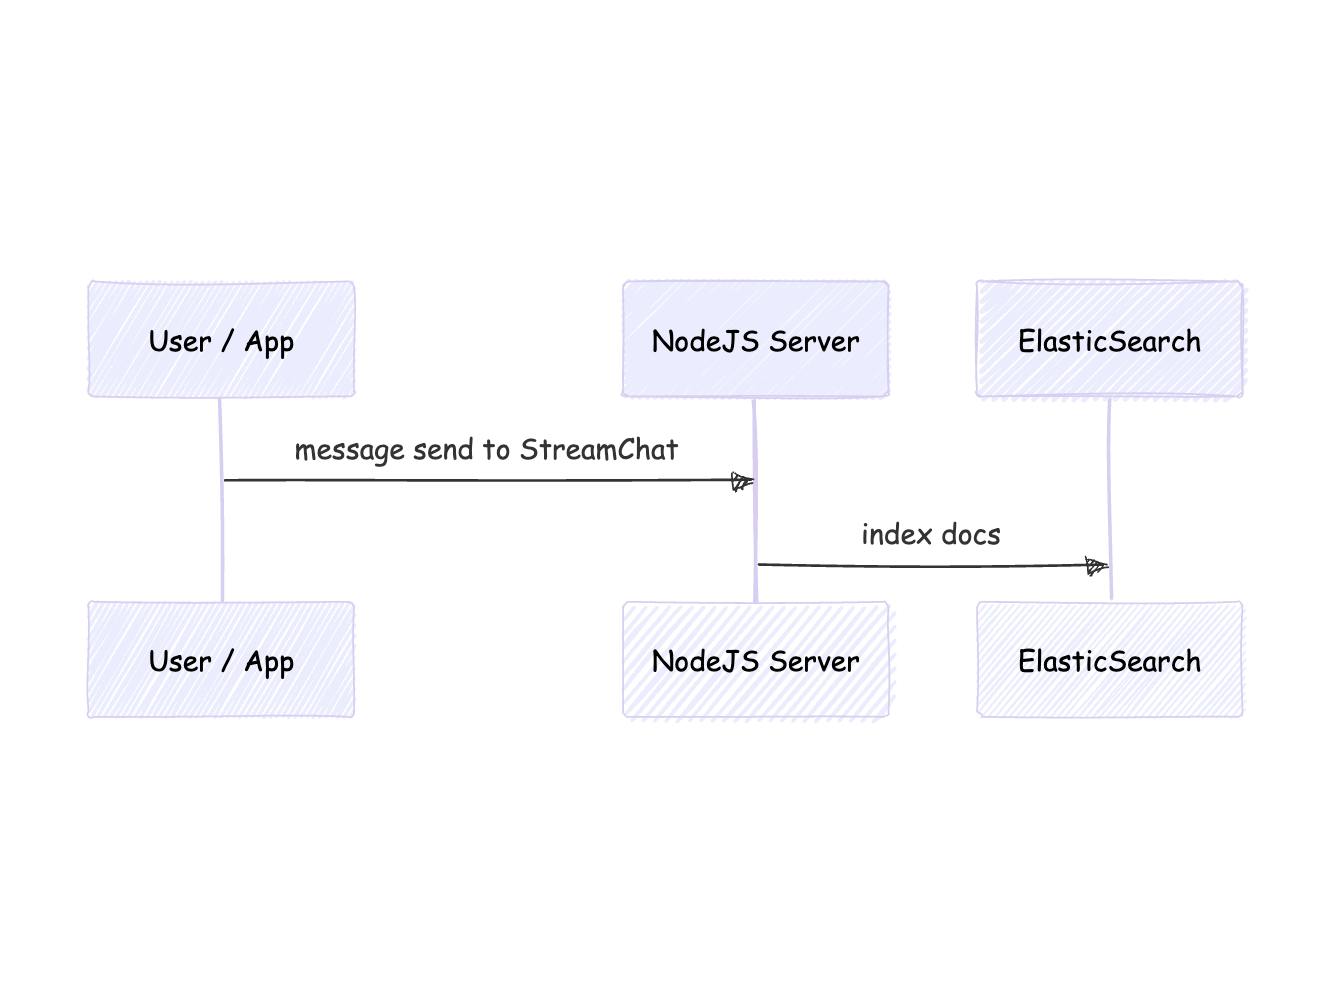
Below is a flow diagram showing the components involved with collecting data:
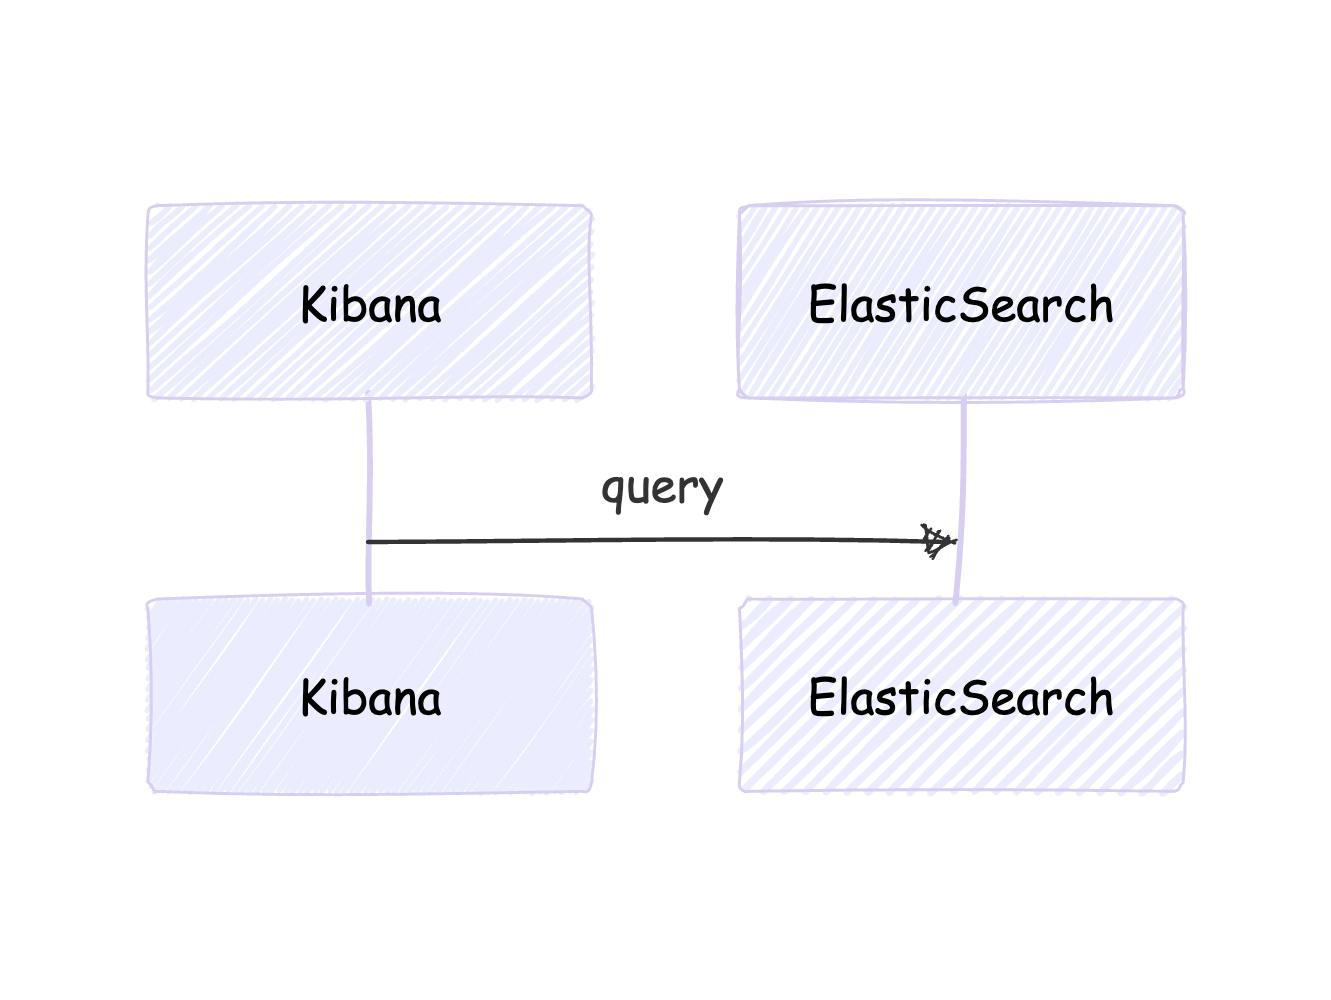
Kibana then uses the data collected by ElasticSearch:
Explanation of the flow diagram:
- User sends a message → Stream triggers
message.new. - Node.js webhook receives the event and indexes the data into Elasticsearch.
- Kibana queries Elasticsearch to visualize chat analytics.
We will briefly go over setting up our Stream Chat with Elasticsearch as we did previously.
Prerequisites & Project Setup
- Node.js (v14+).
- Stream Chat account
- Sign up for free or log in, create an app, and note your API Key & API Secret.
- Docker (to run Elasticsearch + Kibana).
- ngrok (optional) if you want to test webhooks locally.
Create Project Folder
1234567mkdir stream-chat-kibana-app

cd stream-chat-kibana-app

npm init -y

npm install express body-parser @elastic/elasticsearch stream-chat dotenv
Create a .env file:
123456789STREAM_API_KEY=<YOUR_STREAM_API_KEY>

STREAM_API_SECRET=<YOUR_STREAM_API_SECRET>

STREAM ID: <YOUR-STREAM-ID>

ELASTICSEARCH_NODE=http://localhost:9200

PORT=3000
Capturing Stream Chat Events via Node.js
We’ll build an Express server to handle message metadata events from Stream. server.js:
Privacy Consideration
Note: Recall that in our previous article, we handled message.new in our express server. However, logging full chat messages in Elasticsearch may raise privacy and security concerns, especially if your application has strict data policies. Since we only need analytics (e.g., message count per user, message size), we will log metadata instead of full message content.
123456789101112131415161718192021222324252627282930313233343536373839404142434445464748495051525354555657585960616263646566676869707172737475767778798081828384858687888990919293949596979899100101import 'dotenv/config';

import express from 'express';

import bodyParser from 'body-parser';

import { Client as ElasticsearchClient } from '@elastic/elasticsearch';

import { StreamChat } from 'stream-chat';

const app = express();

app.use(bodyParser.json());

const esClient = new ElasticsearchClient({

  node: process.env.ELASTICSEARCH_NODE

});

try {

  const info = await esClient.info();

  console.log('Elasticsearch connected:', info);

} catch (err) {

  console.error('Elasticsearch connection error:', err);

}

const serverClient = StreamChat.getInstance(

  process.env.STREAM_API_KEY,

  process.env.STREAM_API_SECRET

);

console.log('Stream server client initialized.');

app.post('/stream-webhook', async (req, res) => {

  try {

    const { type, message } = req.body;

    console.log('Webhook event type:', type);

    if (type === 'message.new') {

      await esClient.index({

        index: 'stream-chat',

        id: message.id,

        body: {

          user_id: message.user.id,

          channel_id: message.channel_id,

          created_at: message.created_at,

          message_size: Buffer.byteLength(message.text, 'utf-8') // Log only the message size

        },

      });

      console.log(`Indexed metadata for message ${message.id} to Elasticsearch`);

    }

    res.status(200).send('Webhook processed');

  } catch (error) {

    console.error('Error in webhook route:', error);

    res.status(500).send('Server error');

  }

});

app.get('/', (req, res) => {

  res.send('Server is up and running');

});

const port = process.env.PORT || 3000;

app.listen(port, () => {

  console.log(`Server listening on port ${port}`);

});
Configure Webhook in Stream:
- If local, run
ngrok http 3000→ sethttps://<ngrok-id>.ngrok.io/stream-webhookin your Stream Dashboard under Events & Webhooks. - Enable
message.new.
Are you confused about how to set ngrok up? Refer to our previous article.
Dockerizing Elasticsearch & Kibana
Create a Docker Network
1docker network create es-network
Launch Elasticsearch
123456789101112131415docker run -d --name es-dev --network es-network \
  -p 9200:9200 -p 9300:9300 \
  -e "discovery.type=single-node" \
  -e "xpack.security.enabled=false" \
  -e "ES_JAVA_OPTS=-Xms512m -Xmx512m" \
  docker.elastic.co/elasticsearch/elasticsearch:8.10.2
  ```

### Launch Kibana

```shell
docker run -d --name kibana-dev --network es-network \
  -p 5601:5601 \
  -e ELASTICSEARCH_HOSTS=http://es-dev:9200 \
  docker.elastic.co/kibana/kibana:8.10.2
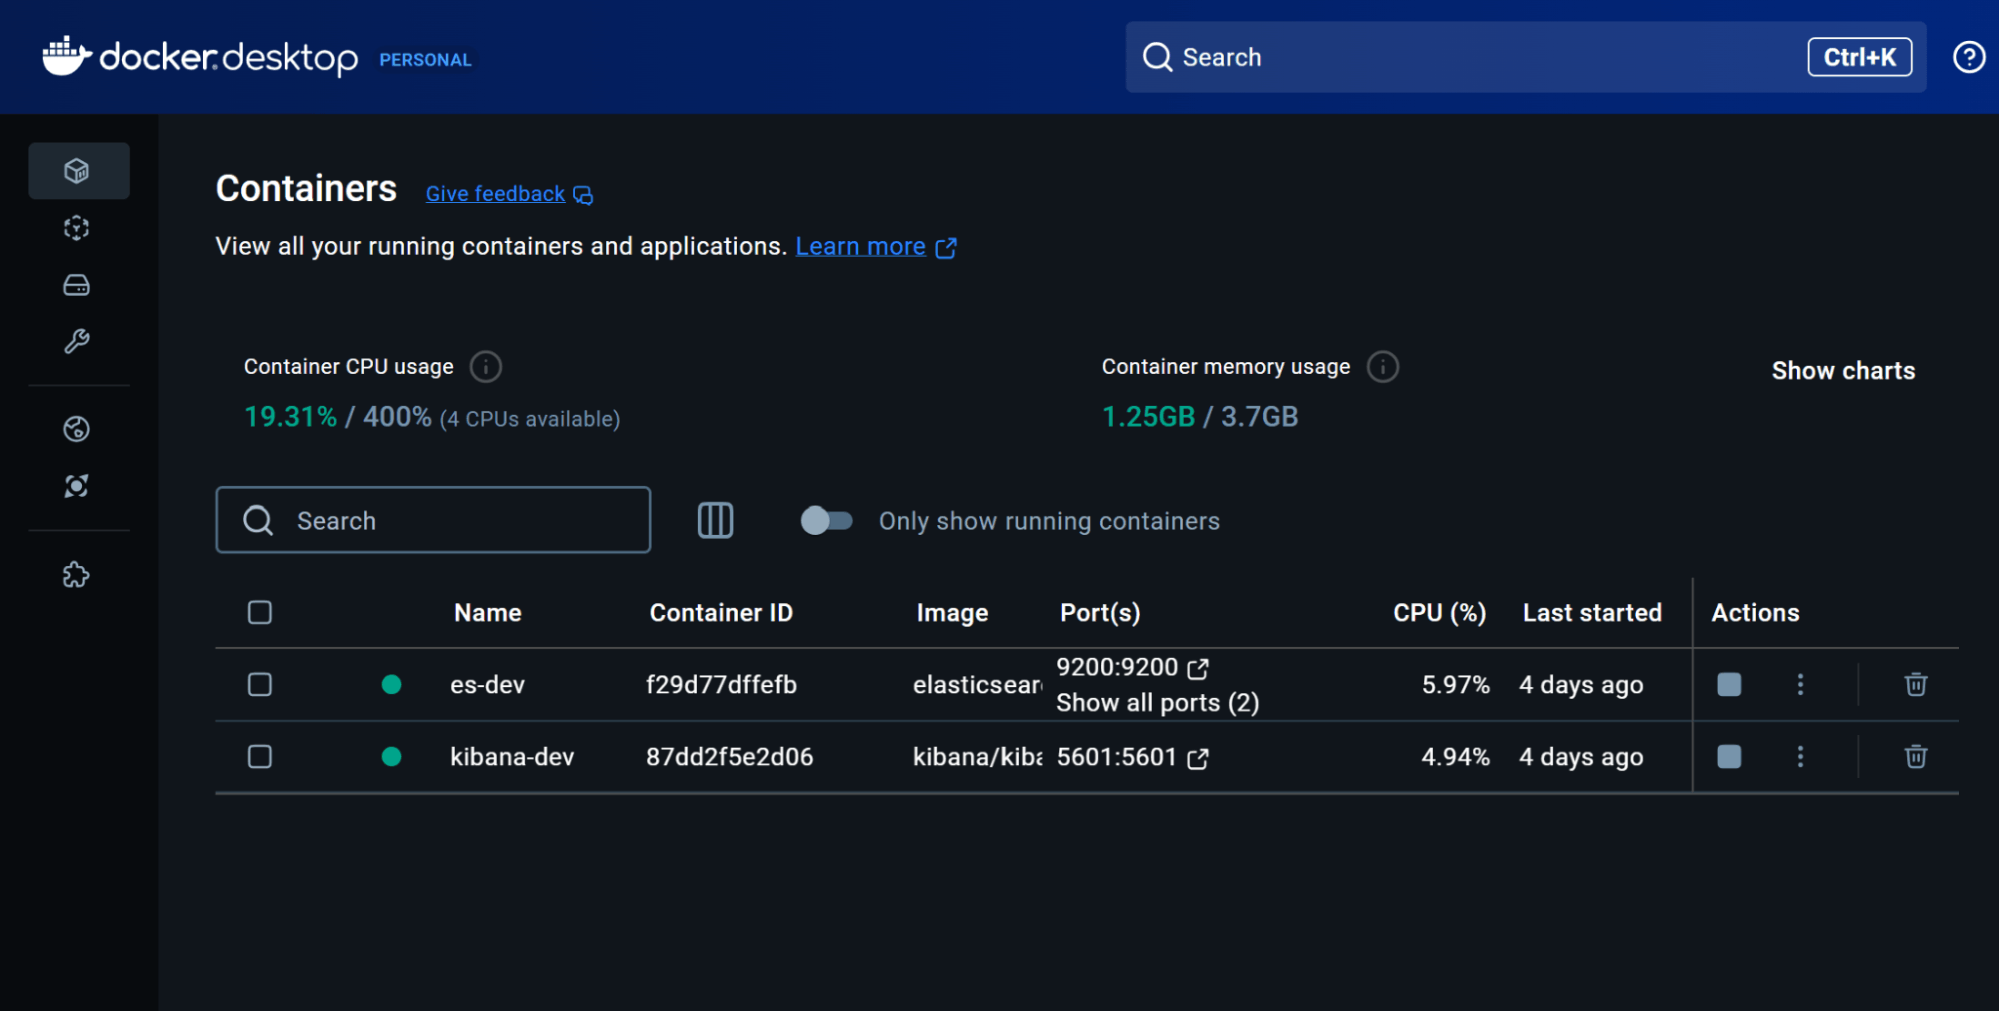
If your docker set-up goes correctly, you should see this on your docker containers page:
After you have confirmed that your setup is correct, check the following URL to see your project come to life!
- http://localhost:5601 → Kibana
- http://localhost:9200 → Elasticsearch
Creating a Data View in Kibana
When Kibana loads, you’ll see a “Welcome to Elastic” screen. Then:
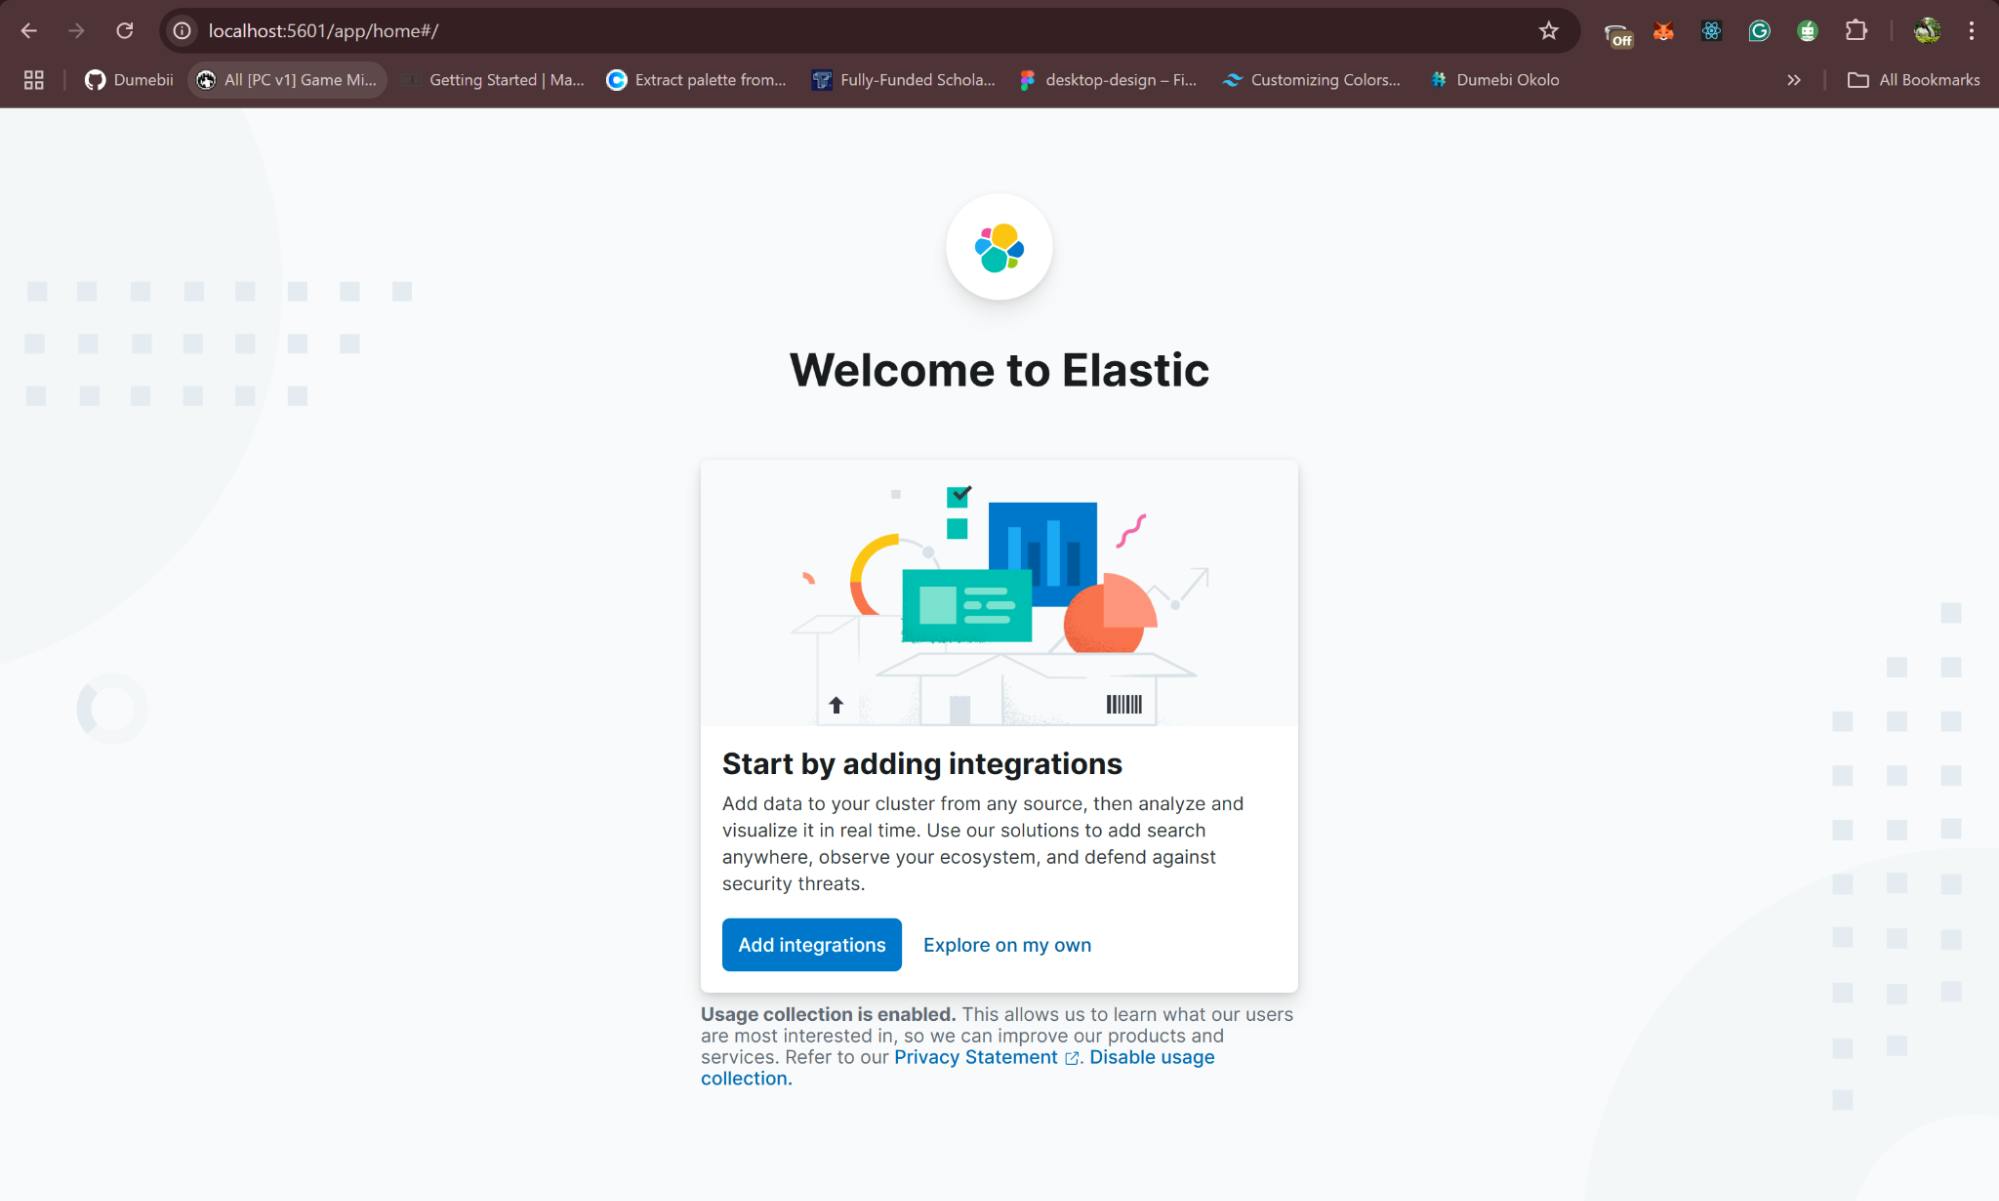
- Go to the “Explore on my own” button to get started!
- Once in the Kibana environment, go to:
- Stack Management → Data Views (Index Patterns in older versions).
- Click Create data view → Type
stream-chat(our index name). - If you have a time field (e.g.
created_at), select it so Kibana can do time-based filtering. - Save.
Now Kibana knows to look at the stream-chat index for data.
Building Visualizations & Dashboards
Discover Your Data
Follow this process to view your chat data:
- Kibana → Discover.
- Select
stream-chatfrom the data view dropdown. - Adjust the time range (top-right) if your data has a date field.
You should see your message data. If not, confirm Node.js is indexing data (check logs or do a GET /_cat/indices in Kibana Dev Tools).

Visualize Message Volume Over Time
If you are interested in knowing the message volume over a given period of time or how many messages are generally being sent using your application, you can easily do this on Kibana.
- Analytics → Visualize Library.
- Create new visualization → Choose Line chart.
- Pick
stream-chatdata view. - X-axis: Date histogram on
created_at. - Y-axis: Count of records.
- (Optional) Split series by
user_idto see multiple lines. - Save your chart.

Kibana gives visualization suggestions to match your data visualization needs.
Dashboard
- Kibana → Dashboard → Create new.
- Add the saved line chart.
- Optional: Add more charts (top channels, user stats).
- Save your dashboard.
Now, you have a custom Kibana dashboard showing real-time chat metrics.
Advanced Kibana Use Cases
- Filters & Drilldowns: Filter by a specific user or channel directly in the chart.
- Geo-based Data: If your messages store location/IP info, plot them on Kibana Maps.
- Machine Learning: Kibana’s ML features can detect anomalies in chat volume or user activity.
- Moderation: Index flagged messages or user bans, then track them with Kibana’s visuals.
Quick Troubleshooting Reference
-
Webhook Not Firing
- Use ngrok if you’re testing locally.
- Ensure
message.newevents are enabled in Stream.
-
Elasticsearch Index Missing
- Check Docker logs for ES startup errors.
- Run
GET _cat/indicesin Kibana Dev Tools to confirm thestream-chatindex.
-
Kibana “Server Not Ready”
- Wait a minute; Kibana can take time to initialize.
- Verify enough Docker memory is allocated (2–4GB recommended).
-
No Documents in Discover
- Make sure your data view (
stream-chat) matches the actual index name. - Check time filter (top-right). If
created_atis out of range, you’ll see zero docs.
- Make sure your data view (
By pairing Stream for real-time messaging with Elasticsearch and Kibana for analytics, you have an efficient feedback loop: instantly updated chat plus dynamic insights into how users interact. With just a few Docker containers and a lightweight Node.js webhook, you can:
- Monitor user engagement and channel popularity in real-time.
- Customize visuals and dashboards that highlight critical metrics.
- Scale to thousands (or millions) of messages while retaining lightning-fast search and analytics.
Whether you run a community platform or build in-app chat for a global audience, this integration helps you monitor user behavior and deliver a data-driven chat experience.
Try out Stream Chat for your project. Explore Kibana’s docs for advanced features like alerting and ML.