








Call statistics
The SDK's default component to display statistics about a call is called CallStats. It displays:
- Call Latency graph that outlines average round trip time (in ms).
- Call Performance section that displays the below listed call statistics
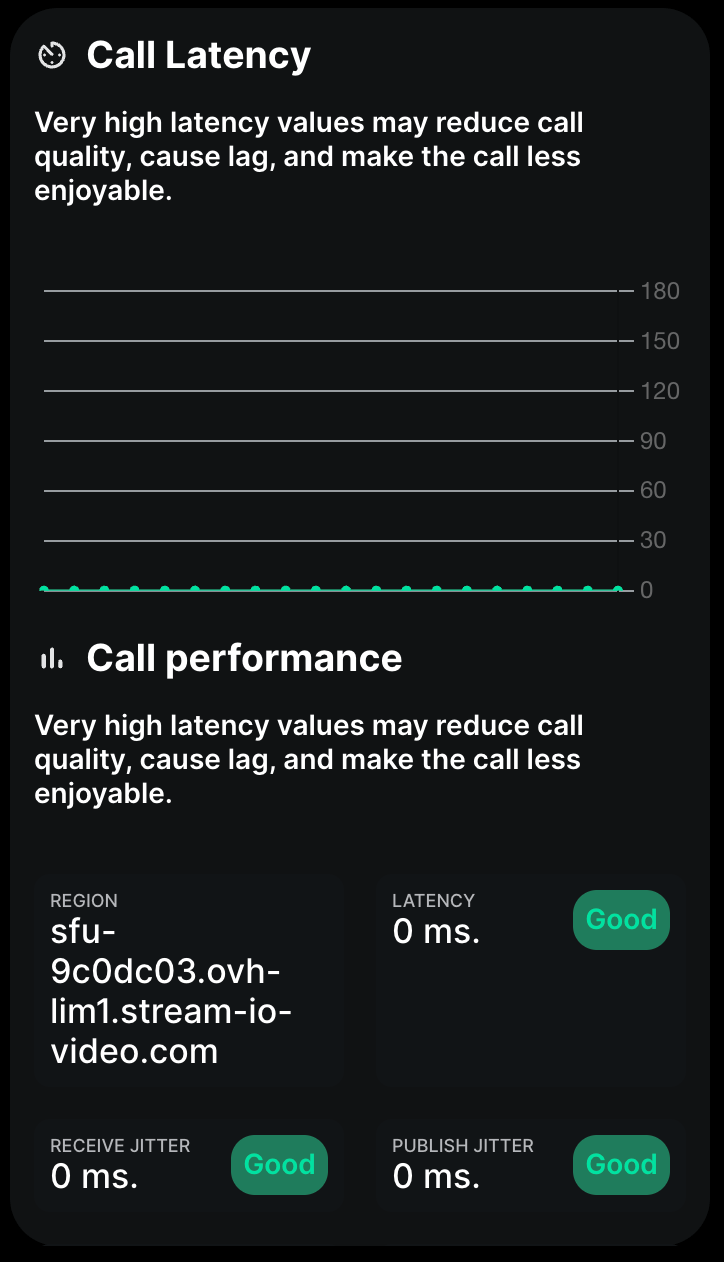
The call statistics displayed
- Region - the server we are connected to
- Latency - the time it takes to deliver the data between the server and the app
- Receive jitter - the variation in the delay of receiving packets of data over a network
- Publish jitter - the variation in the delay of sending packets of data over a network
- Publish resolution - video resolution we are publishing
- Publish quality drop reason - optional explanation of the reason, why the video image quality we are sending has diminished
- Receiving resolution - video resolution we are receiving
- Receive quality drop reason - optional explanation of the reason, why the video image quality we are receiving has diminished
- Publish bitrate - the rate at which data is transmitted from the app to the server
- Receiving bitrate - the rate at which data is transmitted from the server to the app
General usage
The default component is just rendered without passing any props:
const MyCallStats = () => {
  // omitted code ...

  return (
    /* omitted code ... */
    <CallStats />
    /* omitted code ... */
  );
};
Props
All props are optional and control the thresholds used to color-code the stats and whether to show extra detail.
| Name | Description | Type | Default |
|---|---|---|---|
latencyLowBound |
Latency (ms) at or below which the value is shown as good | number |
75 |
latencyHighBound |
Latency (ms) at or above which the value is shown as poor | number |
400 |
audioJitterLowBound |
Audio jitter (ms) at or below which the value is shown as good | number |
10 |
audioJitterHighBound |
Audio jitter (ms) at or above which the value is shown as poor | number |
30 |
videoJitterLowBound |
Video jitter (ms) at or below which the value is shown as good | number |
20 |
videoJitterHighBound |
Video jitter (ms) at or above which the value is shown as poor | number |
50 |
showCodecInfo |
Whether to display codec information | boolean |
false |
LatencyChartSuspenseFallback |
Fallback rendered while the latency chart is loading | ReactNode |
null |
Customization
You can create your own call statistics component using the SDK's call state hooks.