Call Statistics
There are two sources of statistics you can use to monitor the performance of your calls:
Call.statsstream that provides real-time webRTC statisticsCallStateproperties that contain some of the webRTC statistics processed and more useful for display purposes
Stats stream
If you want to tap in directly into the stream of webRTC stats you can do this with stats steam inside Call object. It provides a stream of CallStats objects for publisher and subscriber connections.
We provide those statistics in three ways for ease of use:
raw- raw stats as they come from the webRTCprintable- representation of the stats that can be easily printed to the console or as a block of textstats- webRTC stats but in a structured form
CallState properties
You can also access more processed data with useful information about the call. This data is available in CallState object. Here are some of the properties that you can use:
publisherStats and subscriberStats - objects that contain the following data:
latency- the time it takes to deliver the data between the server and the appjitterInMs- the variation in the delay of receiving packets of data over a networkbitrateKbps- the rate at which data is transmitted from the app to the server (publisher) or from the server to the app (subscriber)
localStats - object that contain the following data:
sfu- the server we are connected tosdkVersion- the version of the Stream SDKwebRtcVersion- the version of the webRTC
latencyHistory - array of latency values for the last 10 seconds
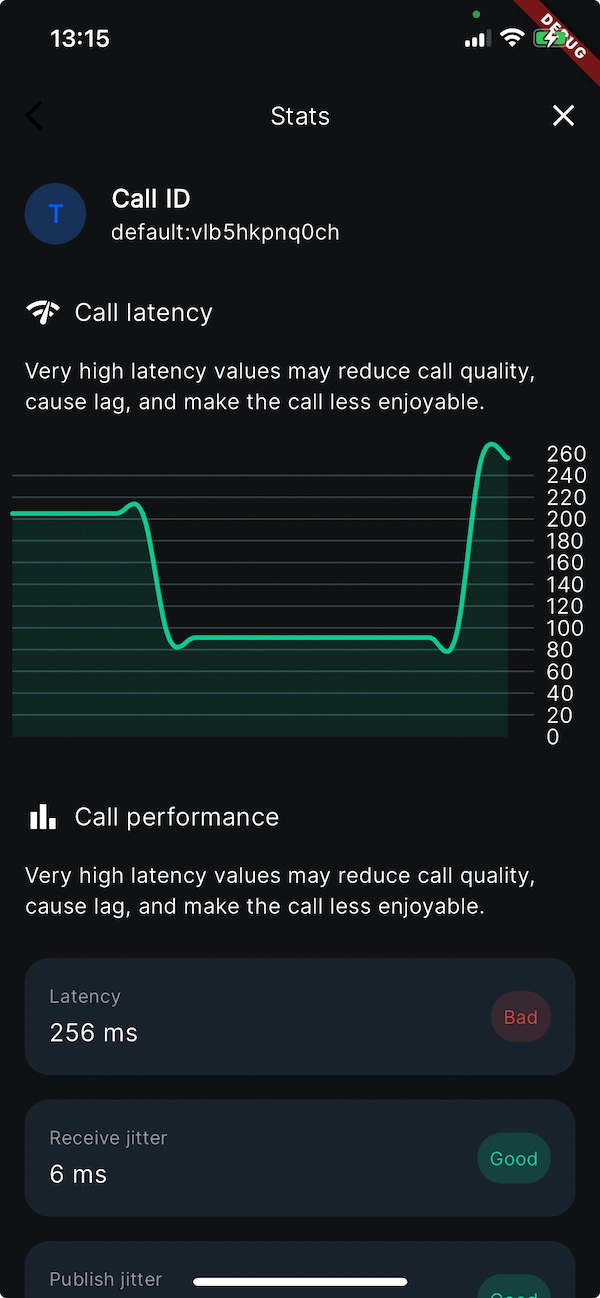
Example usage
You can check the example of the stats screen in our demo app