Dashboard & Debugging
The Stream dashboard provides tools for monitoring active SIP calls and debugging common issues.
SIP Section in the Dashboard
The SIP section in the Stream dashboard gives you an overview of your SIP trunks, routing rules, and active calls. Navigate to it from the Video section in the sidebar.
Monitoring Active Calls
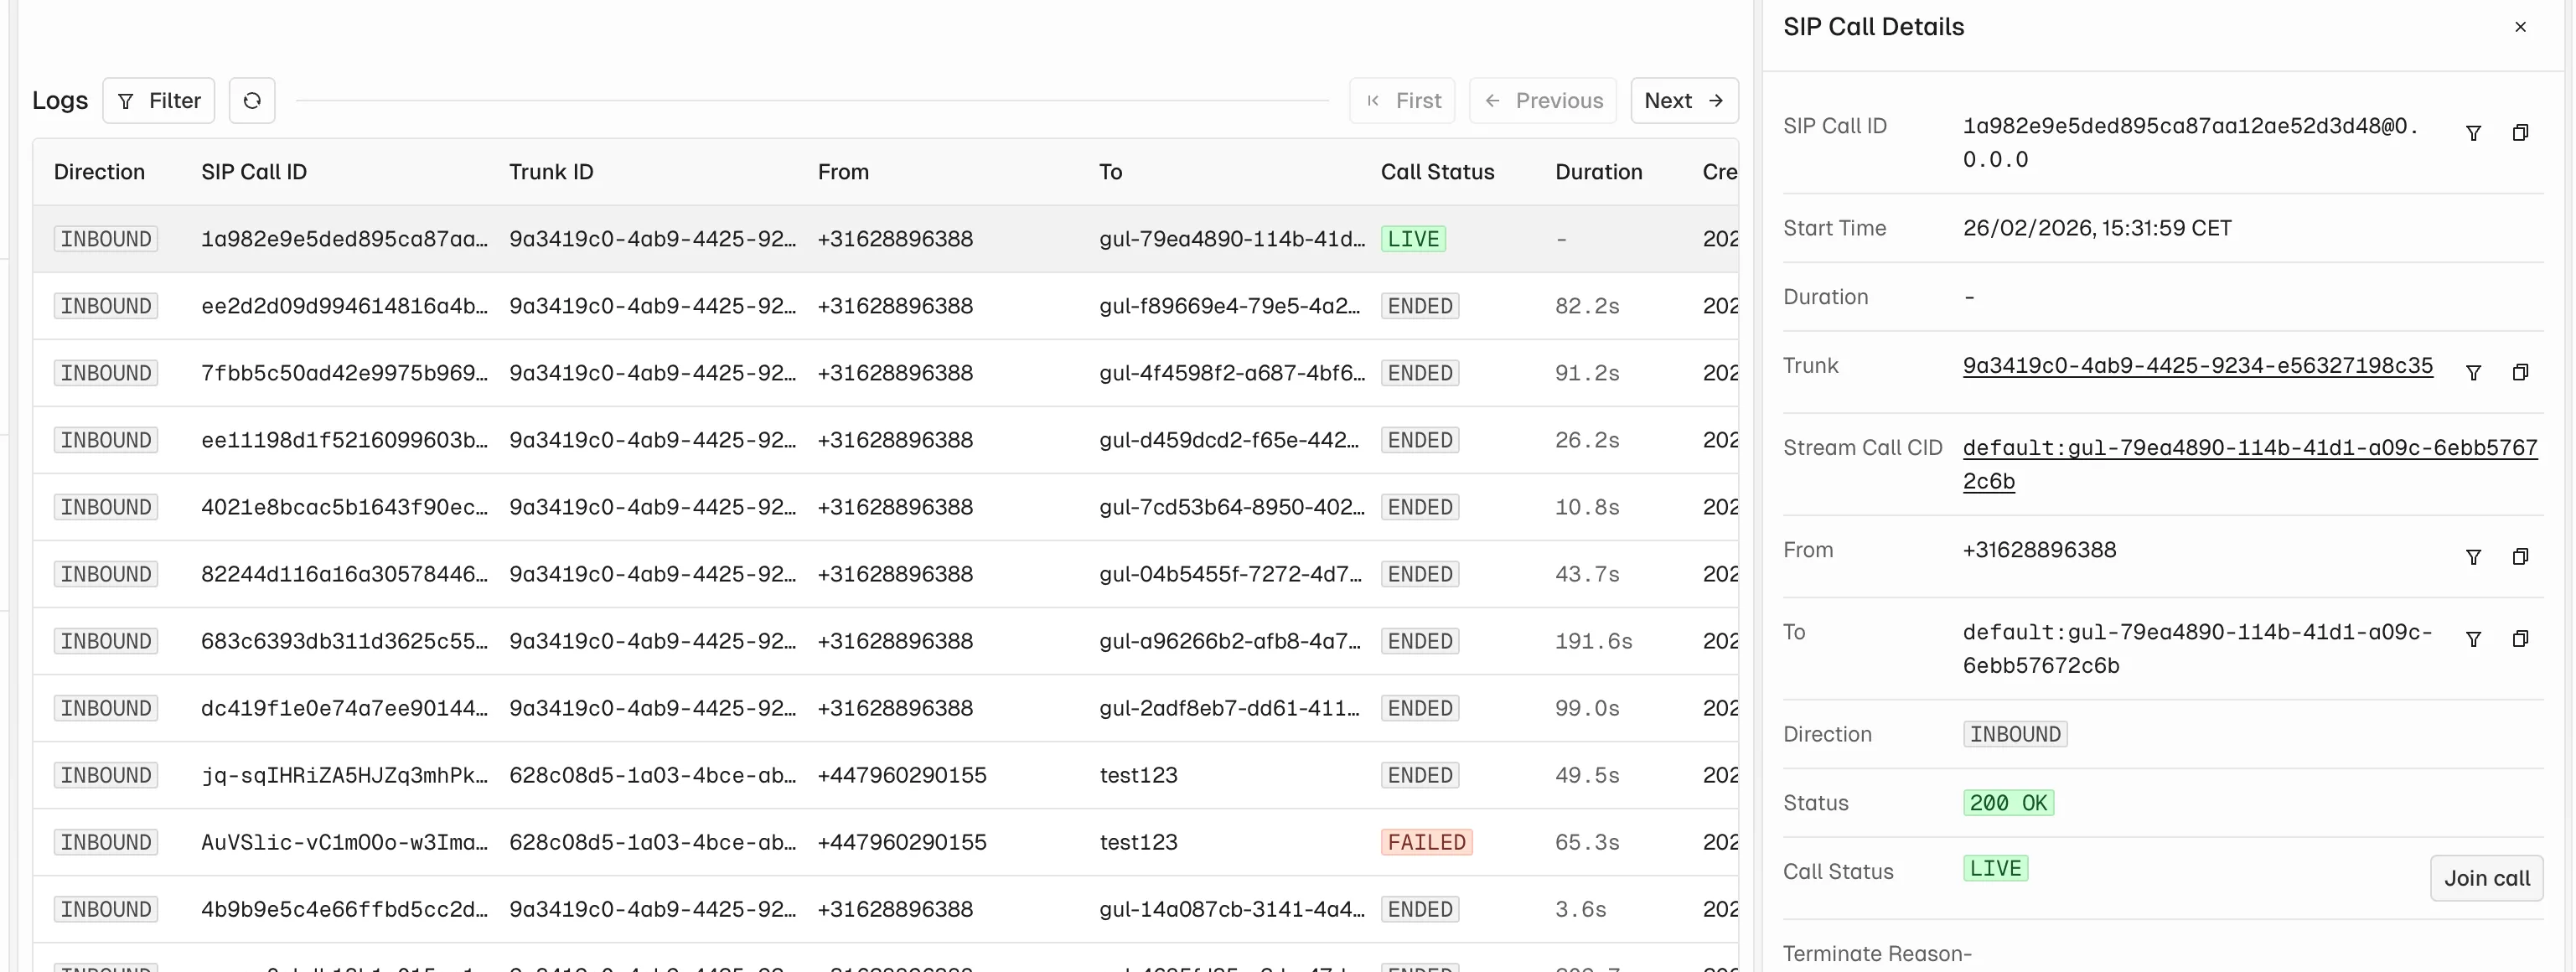
Once a SIP call is connected to a Stream call, you can see it in the dashboard in real time. The call monitoring view shows participants, call duration, and connection status.
Joining a Call for Testing
You can join any active call directly from the dashboard to test the audio connection and verify that SIP participants are connected correctly. This is useful during initial setup and integration testing.
Debugging Common Issues
Authentication Failures
- Verify the username and password in your provider's SIP configuration match the credentials from your Stream trunk.
- Ensure the SIP bridge address is correct.
Routing Misconfiguration
- Check that your routing rule (Fixed or Dynamic Call ID) is configured correctly in the trunk settings.
- For Dynamic Call ID, verify the template pattern matches your expected call IDs.
Firewall Issues
- Stream's SIP bridge requires specific ports to be open for SIP signaling (typically UDP 5060) and RTP media.