








Call Statistics
The CallStats panel that v1 shipped is no longer part of the SDK. The data behind it is still there - useCallStatsReport() emits a full report every two seconds - so a stats panel is now something you assemble yourself, which is what this recipe does.
Doing it by hand is also what lets the panel match your product: you decide which numbers deserve screen space, what counts as a bad value, and whether stats live in a drawer, a debug overlay, or a support-only screen.
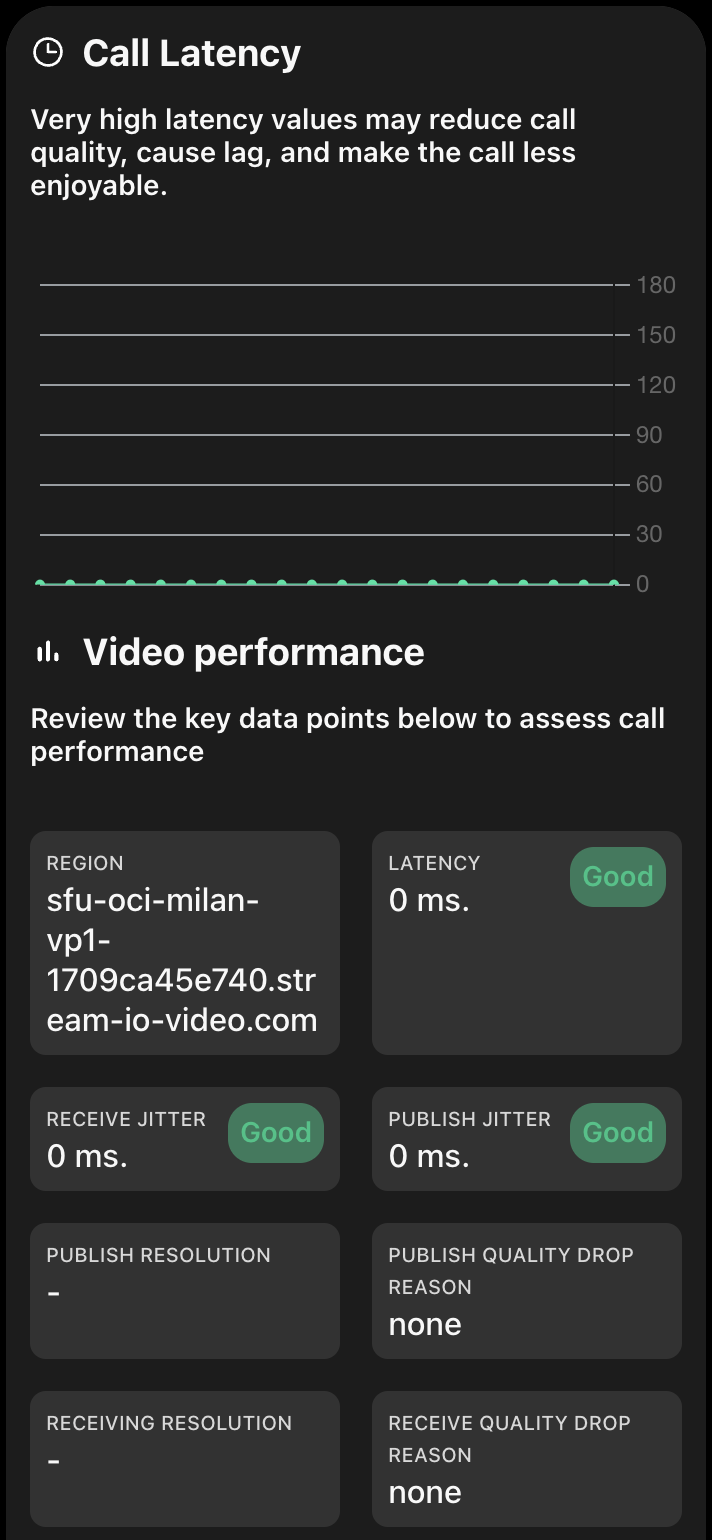
What to display
useCallStatsReport() returns aggregated publisher and subscriber stats rather than raw WebRTC dumps, so most of the panel is a direct read of the report. See the Call Stats Report guide for the full shape.
| Stat | Where it comes from | What it tells the user |
|---|---|---|
| Region | datacenter |
The edge server the participant is connected to |
| Latency | publisherStats.averageRoundTripTimeInMs |
Time to deliver data between the app and the server |
| Receive jitter | subscriberStats.averageJitterInMs |
Variation in the delay of incoming packets |
| Publish jitter | publisherStats.averageJitterInMs |
Variation in the delay of outgoing packets |
| Publish resolution | publisherStats.highestFrame{Width,Height,sPerSecond} |
The video resolution being sent |
| Publish quality drop reason | publisherStats.qualityLimitationReasons |
Why outgoing quality dropped - usually cpu or bandwidth |
| Receiving resolution | subscriberStats.highestFrame{Width,Height,sPerSecond} |
The video resolution being received |
| Publish bitrate | derived from publisherStats.totalBytesSent |
Rate at which data leaves the app |
| Receiving bitrate | derived from subscriberStats.totalBytesReceived |
Rate at which data arrives from the server |
| Codec | publisherStats.codec, subscriberStats.codec |
Useful when debugging, noise for everyone else |
Latency, jitter and the quality drop reasons are the three that actually explain a bad call. The rest is supporting detail - a panel that shows only those three is a legitimate panel.
Thresholds
Raw milliseconds mean nothing to most users, so color-code them. These are the bounds the v1 component used, and they are a sound starting point:
export const STATS_THRESHOLDS = {
  latency: { good: 75, poor: 400 },
  audioJitter: { good: 10, poor: 30 },
  videoJitter: { good: 20, poor: 50 },
} as const;

export type Grade = "good" | "ok" | "poor";

export const grade = (
  value: number | undefined,
  { good, poor }: { good: number; poor: number },
): Grade | undefined => {
  if (value === undefined) return undefined;
  if (value <= good) return "good";
  if (value >= poor) return "poor";
  return "ok";
};
Deriving bitrate
Bitrate is not in the report - totalBytesSent and totalBytesReceived are cumulative counters. To turn them into a rate, keep the previous report and divide the byte delta by the time delta:
import type { CallStatsReport } from "@stream-io/video-react-sdk";

export const toBitrateKbps = (
  current: number | undefined,
  previous: number | undefined,
  elapsedMs: number,
): number | undefined => {
  if (current === undefined || previous === undefined || elapsedMs <= 0) {
    return undefined;
  }
  const deltaBytes = current - previous;
  // counters reset when the peer connection is re-established
  if (deltaBytes < 0) return undefined;
  return (deltaBytes * 8) / elapsedMs;
};
Bytes times 8 over milliseconds gives kilobits per second directly, so no extra scaling is needed.
Keeping a history
A single report is a snapshot. Buffering the last N reports gives you a latency sparkline and smooths out the jumpiness of instantaneous values:
import { useEffect, useRef, useState } from "react";
import {
  useCallStateHooks,
  type CallStatsReport,
} from "@stream-io/video-react-sdk";

const HISTORY_SIZE = 20; // 20 reports x 2s = the last ~40 seconds

export const useStatsHistory = () => {
  const { useCallStatsReport } = useCallStateHooks();
  const report = useCallStatsReport();
  const [history, setHistory] = useState<CallStatsReport[]>([]);

  useEffect(() => {
    if (!report) return;
    setHistory((previous) => [...previous, report].slice(-HISTORY_SIZE));
  }, [report]);

  return { report, history };
};
Reports are emitted on a timer, so this effect runs once every two seconds - cheap enough to keep in component state.
The panel
Putting it together. previous is the report before the current one, which is what the bitrate calculation needs:
export const CallStatsPanel = () => {
  const { report, history } = useStatsHistory();

  if (!report) return <p>Gathering call statistics...</p>;

  const previous = history[history.length - 2];
  const elapsedMs = previous ? report.timestamp - previous.timestamp : 0;

  const latency = report.publisherStats?.averageRoundTripTimeInMs;
  const publishJitter = report.publisherStats?.averageJitterInMs;
  const receiveJitter = report.subscriberStats?.averageJitterInMs;

  const publishBitrate = toBitrateKbps(
    report.publisherStats?.totalBytesSent,
    previous?.publisherStats?.totalBytesSent,
    elapsedMs,
  );
  const receiveBitrate = toBitrateKbps(
    report.subscriberStats?.totalBytesReceived,
    previous?.subscriberStats?.totalBytesReceived,
    elapsedMs,
  );

  return (
    <dl className="my-call-stats">
      <Stat label="Region" value={report.datacenter} />
      <Stat
        label="Latency"
        value={latency && `${Math.round(latency)} ms`}
        grade={grade(latency, STATS_THRESHOLDS.latency)}
      />
      <Stat
        label="Publish jitter"
        value={publishJitter && `${publishJitter.toFixed(1)} ms`}
        grade={grade(publishJitter, STATS_THRESHOLDS.videoJitter)}
      />
      <Stat
        label="Receive jitter"
        value={receiveJitter && `${receiveJitter.toFixed(1)} ms`}
        grade={grade(receiveJitter, STATS_THRESHOLDS.videoJitter)}
      />
      <Stat
        label="Publish resolution"
        value={formatResolution(report.publisherStats)}
      />
      <Stat
        label="Receiving resolution"
        value={formatResolution(report.subscriberStats)}
      />
      <Stat
        label="Publish bitrate"
        value={publishBitrate && `${publishBitrate.toFixed(0)} kbps`}
      />
      <Stat
        label="Receiving bitrate"
        value={receiveBitrate && `${receiveBitrate.toFixed(0)} kbps`}
      />
      <Stat
        label="Quality drop reason"
        value={report.publisherStats?.qualityLimitationReasons}
      />
    </dl>
  );
};
The two small helpers the panel leans on:
const formatResolution = (stats?: {
  highestFrameWidth?: number;
  highestFrameHeight?: number;
  highestFramesPerSecond?: number;
}) => {
  if (!stats?.highestFrameWidth || !stats.highestFrameHeight) return undefined;
  const { highestFrameWidth, highestFrameHeight, highestFramesPerSecond } =
    stats;
  const resolution = `${highestFrameWidth}x${highestFrameHeight}`;
  return highestFramesPerSecond
    ? `${resolution}@${highestFramesPerSecond}`
    : resolution;
};

const Stat = ({
  label,
  value,
  grade,
}: {
  label: string;
  value?: string | number;
  grade?: Grade;
}) => (
  <div className={grade ? `my-call-stats__stat--${grade}` : undefined}>
    <dt>{label}</dt>
    <dd>{value ?? "-"}</dd>
  </div>
);
Every value is optional. A report arriving before the first frame is published has no publisher resolution, and qualityLimitationReasons is absent while nothing is limiting quality - which is the common case, and worth rendering as nothing rather than as an empty row.
Where to put it
Stats are a diagnostic, not a feature. Two placements that work:
- Behind a toggle in the call controls, for calls where users are expected to troubleshoot their own connection. See replacing call controls.
- In a support-only overlay, gated behind a query parameter or a staff flag, so your support team can read the numbers off a user's screen without the panel existing for everyone else.
The reporting interval is configurable, and stats gathering can be switched off entirely for builds that never show a panel:
// report every 3.5 seconds instead of the default 2
call.setStatsReportingIntervalInMs(3500);

// or turn stats gathering off
call.setStatsReportingIntervalInMs(0);
Keep the interval at two seconds or above - anything faster burns CPU for numbers that no one can read that quickly.
Related
- Call Stats Report - the full report shape, and per-participant stats
- Network quality indicator - the per-participant version of the same idea
- Pre-call self-test - surfacing these numbers before the call starts